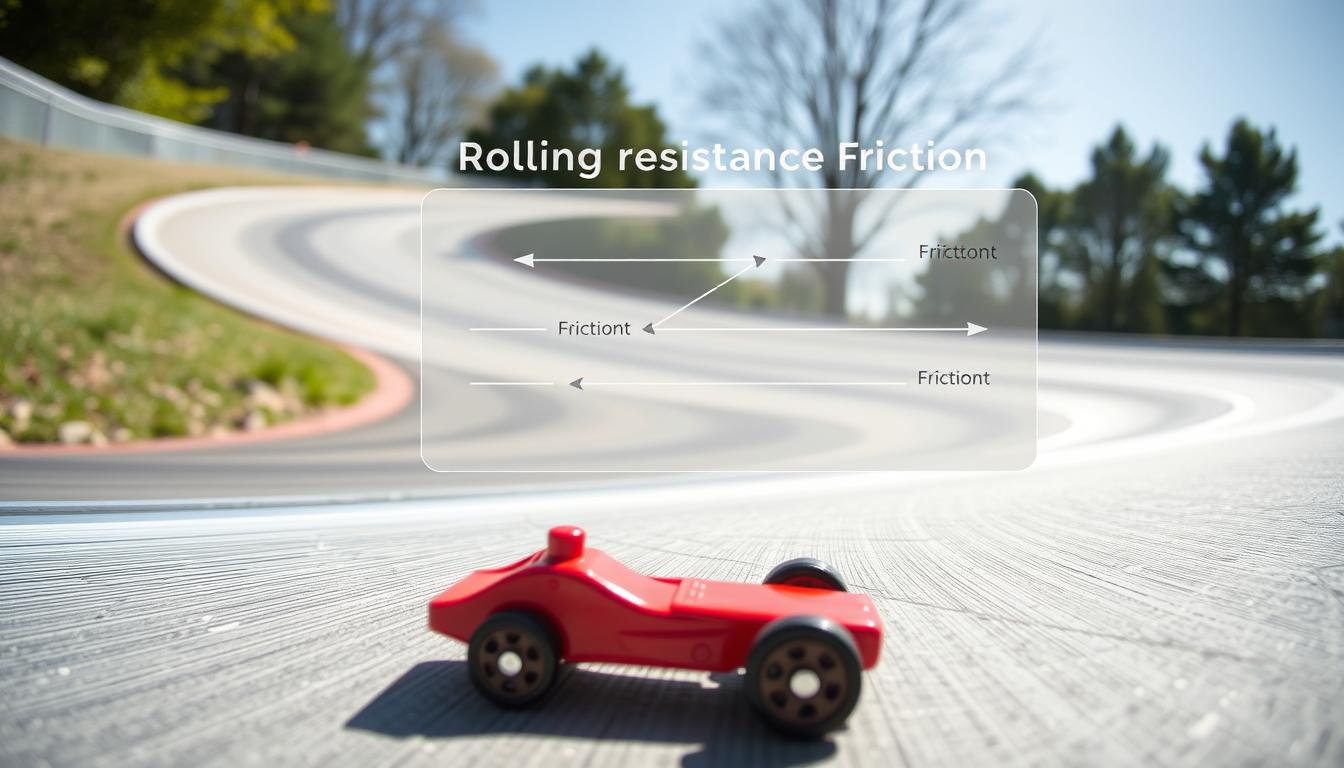
Ever push a grocery cart with that one wobbly wheel? That frustrating drag is your first encounter with a fundamental force of physics. It’s not just bad Walmart engineering—it’s rolling resistance in action.
Now, imagine a train. Picture a massive railcar sitting on level steel rails. You might think moving it would require Herculean effort, right? But surprisingly, no. The rolling resistance here is remarkably low. It’s Newton’s first law playing out: an object in motion tends to stay in motion, unless something—like friction—stops it.
This sneaky force is where the real-world physics gets interesting. It’s the hidden term in equations like the Davis Formula that engineers use. That subtle grind against motion isn’t just academic—it’s what quietly saps energy from every moving thing, from your morning commute to cross-country freight.
So what happens when we add curves, hills, and imperfect track to the equation? Let’s break down the physics behind why not all paths are created equal.
Grade: The Tyranny of the Incline
A hill is not just a view for a train; it’s a challenge to its power. The grade percentage shows how much a train must work against gravity. A small hill can be tough for a train, like a heavy load for a human.
For every 1% of grade, a train faces 20 pounds of resistance for every ton of weight it pulls. This is a rule that trains must follow. A 1% grade means 20 extra pounds of force per ton of train. For a 10,000-ton coal train, that’s an extra 200,000 pounds of force the engines must generate just to fight gravity’s pull.
Let’s put this “20 lbs per ton per percent grade” into a table to see the tyranny of the incline in action. The force required doesn’t just increase; it compounds with both weight and grade.
| Grade (%) | Force per Ton (lbs) | Total Force for a 1,000-ton train (lbs) | Analogy |
|---|---|---|---|
| 0.5% | 10 lbs/ton | 10,000 lbs | Pulling a small car up a gentle slope. |
| 1.0% | 20 lbs/ton | 20,000 lbs | Haling the weight of a loaded school bus. |
| 2.0% | 40 lbs/ton | 40,000 lbs | Overcoming the pull of two school buses. |
| 2.5% | 50 lbs/ton | 50,000 lbs | The force needed to pull 25 average cars. |
| 3.0% | 60 lbs/ton | 60,000 lbs | The maximum grade on many mainline railways. |
This isn’t just math; it’s a direct order to the locomotive: work harder. Doubling the grade from 1% to 2% doesn’t just double the problem; it squares the challenge for a heavy train. That “20 lbs/ton/1% grade” rule is the engineer’s gut-check formula. It translates the abstract concept of a slope into a tangible, Herculean force. It’s the difference between a leisurely pull and a Sisyphean ordeal where every percent of grade is another shove against the boulder.
So, when you see a train snaking up a mountain pass, remember: it’s not just climbing a hill. It’s fighting a continuous, calculated battle against gravity, where every single percentage point of grade % is a tax paid in horsepower, fuel, and sheer mechanical will.
Curve Radius, Flange Friction, and Over‑Speed Risks
Bending the rail isn’t just a design choice—it’s an energy tax with interest paid in friction. This section of track is where elegant physics meets gritty reality. Your locomotive’s efficiency gets a reality check here.
Train wheels aren’t flat disks. They’re cleverly conical—wider at the flange, tapering inward. On straight track, this design self-centers the train. But introduce a curve radius, and the geometry demands a sacrifice.
The outer wheel must travel a longer path than the inner one. They’re locked on the same axle, so something has to give. The wheels slip and slide, scrubbing against the rails in a metallic protest. That precious forward momentum you worked so hard to build? It transforms into squealing flange wear and wasted heat.
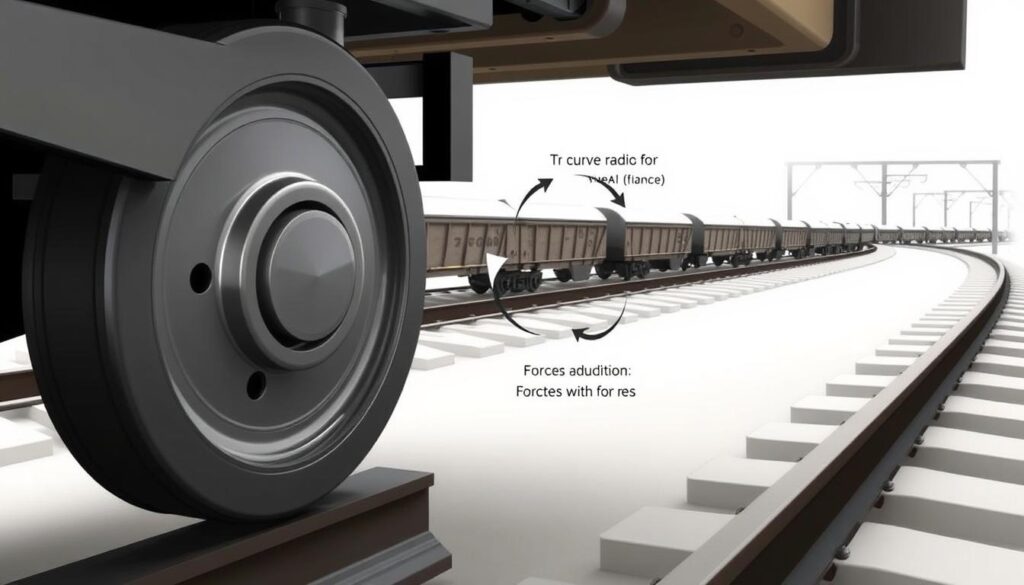
Engineers measure this bend not just by radius, but by degrees of curvature. Think of it as the track’s sharpness rating. A gentle, sweeping curve might be 2 degrees. A tight turn in a yard could hit 10 degrees or more.
Here’s where the math gets sobering. The friction fighting that wheel slip creates curve resistance. Using standard friction equations, we can calculate that a 10-degree curve adds drag equivalent to a 1% sustained grade. Your train isn’t just going around a bend—it’s climbing an invisible hill.
Push the speed too high on a tight curve, and you court over-speed risks. The forces trying to fling your train outward increase with velocity. It’s physics’ version of a bank charging higher interest on a risky loan. The flanges grind harder, heat builds, and energy drain spikes.
This is where abstract geometry meets the workshop floor. That gentle bend in your layout isn’t just scenic—it’s a power meter running in the background. Designing with curve radius in mind isn’t optional; it’s fundamental to energy-smart operation.
Build a Test Hill and Curve Module (cardboard/foam)
Enough theory. Let’s move from the lecture hall to the workshop. We’ll build a physical model where friction becomes real.
This isn’t a grade-school diorama. It’s a functional microcosm of railway engineering. We’ll create a simple test track with a hill and a curve to see energy loss in action.
Gather your supplies. You don’t need a machine shop. Look in your recycling bin and desk drawer.
- Track Bed: Corrugated cardboard or thick foam board. This is our “earth.”
- Train: A steel marble or ball bearing. Its weight and smooth roll are perfect.
- Tools: A ruler, a pencil, a sharp craft knife, and strong tape (packing tape works best).
- Support: Books or boxes to create elevation for the hill.
Now, build your two test modules. First, the grade. Cut a straight strip of cardboard about two feet long. Prop one end on a stack of books to create a steady incline—a 10-15% grade is a good start. Secure it firmly. This is your hill climb.
Second, the curve. Cut another strip. Gently bend it into a smooth arc and tape it flat to your work surface. This is your unbanked turn. Make sure both modules start at the same height, so your “train” has the same energy at the start.
Place your marble at the top of each module and let it go. Observe everything. Listen. You’ll see the marble slow down on the hill as gravity fights the climb. You’ll hear and see the marble skitter on the flat curve as it fights its own path.
This friction isn’t a bug; it’s the feature we’re testing. On the curve, it’s the flange scrubbing against our cardboard rail. On the grade, it’s the work needed to lift mass against gravity. In the real world, managing this friction is key in train design.
Your model is now a calibrated instrument. You’ve built the stage. Next, we’ll put on the play and measure the performance.
Measure Time Up/Down Grades; Compute Power Proxy (mgh/t)
It’s time to get serious with numbers. We’ve built our foam hill and talked about the physics. Now, we’ll measure our model car’s climb and descent. We’ll find the energy needed to go up and down: the power proxy, mgh/t.
You’ll need a stopwatch, your foam-and-cardboard hill, and a toy car with known mass. Mark a start and finish line on your 10% grade. Release the car and time how long it takes to climb. Do this a few times and average the times. Then, do the same for the descent. The difference in times tells us a lot.
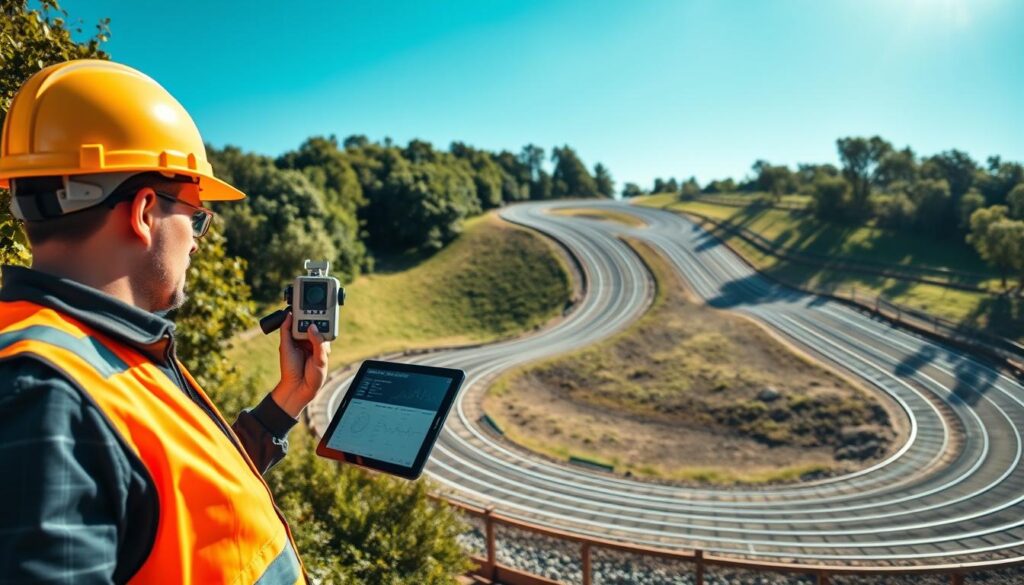
Now, let’s do some math that will impress your high school physics teacher. We’re not finding the engine’s true power. Instead, we’re finding a power proxy that shows the work against gravity. The formula is simple:
Power Proxy = (m × g × h) / t
Where ‘m’ is the car’s mass (in kg), ‘g’ is gravity (9.8 m/s²), ‘h’ is the hill’s height, and ‘t’ is the climb time. This (mgh) is the energy gained, and dividing by time gives us Watts. It shows the power needed to beat gravity. It’s the physics of the grade, plain and simple.
Let’s see what numbers might look like for a 0.5kg model car on our 0.3m tall foam hill.
| Direction | Avg. Time (s) | Height (m) | Mass (kg) | Power Proxy (W) |
|---|---|---|---|---|
| Uphill | 4.2 | 0.3 | 0.5 | 0.35 |
| Downhill | 1.8 | 0.3 | 0.5 | 0.82 |
The power proxy for climbing is 0.35W. But going down, with gravity’s help, is faster and shows a higher proxy number. This shows the hill’s energy tax clearly. The car’s motor must meet this minimum or it won’t move.
This simple physics is powerful. It changes “the hill is hard” to “this grade demands 0.35 Watts.” It gives us a number for the energy cost. It’s the difference between feeling a hill is steep and knowing exactly how steep.
This simple proxy, mgh/t, is a lens. It shows why long mountain grades are tough for engines. It’s not just about torque; it’s about the power to overcome gravity.
Compare Straight vs. Curved Track Time at Same Throttle
Imagine a drag race between two identical model trains. One track is straight, the other is curved. Both trains have the same power. Which one wins? The answer shows us how physics works.
The straight track is like the fast hare. The curved track is like the slow tortoise. This race is about geometry and energy. The straight track wins because it’s more efficient.
Why does the curve lose? It’s because of friction between the wheel and rail. On a straight track, the main resistance is just rolling. But on a curve, the wheel flanges rub against the rail. This is called flange friction.
The Davis Formula shows how much resistance a train faces. For straight tracks, it’s simple. But for curves, there’s extra friction. On a 10-degree curve, it’s like climbing a small hill.
Let’s look at our model. We have a 1-meter straight track and a 1-meter radius curve. Both trains have the same power. We time how long each takes to travel 1 meter. The results show how much energy is wasted.
| Track Type | Average Time (seconds) | Calculated Energy Loss vs. Straight Track | Primary Source of Energy Loss |
|---|---|---|---|
| Straight Track | 2.1s | 0% (Baseline) | Rolling resistance only |
| Curved Track (1m radius) | 3.4s | +62% | Flange friction & scrubbing |
| Curved Track (0.5m radius) | 4.8s | +129% | High flange friction, wheel slip |
The data shows the curved track takes over 60% longer on a gentle curve. On a tight curve, it’s more than twice as long. This isn’t about speed; it’s about energy.
Think of it like this: on a straight, your engine invests power in moving forward. On a curve, it’s like shouting over a jackhammer. Most energy is lost to noise. This is the “sapping” effect of curves.
So, the next time you’re stuck in traffic on a curved highway on-ramp, remember you’re not just turning—you’re fighting physics, one wheel revolution at a time. The curved track doesn’t just make the journey longer; it makes the engine work harder for every inch gained. In the race between the straight and the curved, the winner is always the path of least friction.
Plotting Results; Interpret Where Energy Is “Lost”
Our data shows that every curve and grade takes a toll on your train’s power. The scatter plot tells a story of energy loss. It shows how steep grades and tight curves are the most expensive parts of our railway.
The straight track is like a flat tax, with little energy loss. But add a curve, and the data points scatter everywhere. That beautiful curve you designed? It’s a power sink. The train’s flanges grind against the rail, turning energy into heat and a loud squeal.
Grade tests tell an even more dramatic story. Each percentage point of incline requires more watts and seconds. Remember that 70-ton room of gravel analogy? Our graphs show the burden it puts on your train.
The energy needed to lift mass against gravity doesn’t vanish. It turns into energy at the crest, but some is lost. This loss comes from the deformation of steel and the constant battle against rolling resistance.
Where does the energy actually go? Our plot shows three main places:
- Heat in the flanges: Friction during curves generates warmth you can feel if you touch the wheel after a hard turn.
- Sound from squealing wheels: The screech isn’t just noise pollution—it’s energy converting to sound waves.
- Micro-deformation of materials: Both rail and wheel compress slightly under load, absorbing energy like a sponge.
Real-world measurements make the analysis sharper. That 150-pound pull needed to move a stationary railcar is the baseline rolling resistance. Our model shows how this resistance grows with track complexity. A gentle curve might add 10% more energy demand. A 5% grade could double it. Combine them, and the energy bill would be huge.
The data tells us that energy isn’t truly “lost.” It’s diverted. Diverted into heating your workshop, making noise, and reshaping materials. This is the hidden cost of interesting track design. Your scatter plot becomes a balance sheet, and rolling resistance is the sneaky line item that’s always higher than you budgeted.
So, what’s the takeaway from our graphical inquisition? Efficiency in model railroading isn’t about eliminating curves and grades—that would be boring. It’s about understanding their true cost. That stunning mountain pass or complex yard ladder comes with an energy price tag our plots now make visible. The next design challenge isn’t just what looks cool, but what your locomotive can actually afford to pull.
Real-World: Banking, Adhesion, and Sand on the Rails
Imagine a 2,000-ton freight train climbing a 2.2% grade in the Sierra Nevada mountains. Unlike our model train’s 2% grade, real railroads use tricks to beat steep grades and curves. These tricks make our model layouts seem like toys.
Superelevation is a key trick. It’s like banking a curve on a racetrack. This lets a 200,000-pound locomotive speed through curves at 60 mph safely. The track’s angle helps the train stay on track, much like leaning into a motorcycle turn.
The banking, or cant, is set with great care. Too little, and the train feels off-balance. Too much, and the inner rail gets damaged. The goal is to balance gravity and centripetal force perfectly. It’s a complex physics problem solved with a lot of steel.
But banking only works for curves. For steep grades, trains use sand. When wheels start to slip, sand is sprayed in front of the drive wheels. This sand increases friction, helping the train stay on track. It’s like using cat litter on icy roads, but for massive trains.
The systems that spray sand are simple but effective. Here’s how different systems handle the same problem:
| System Type | Deployment Method | Primary Use Case | Advantage |
|---|---|---|---|
| Gravity-Fed Hopper | Sand falls from a hopper above the rail | Steep grades, icy conditions | Simple, reliable, low-tech |
| Pneumatic Blower | Air pressure propels sand | Heavy freight, sustained grades | Precise, even distribution |
| Electro-Pneumatic | Computer-controlled valves | Modern high-speed rail | Maximum efficiency, minimal waste |
| Manual Application | Hand-crank or lever | Vintage/steam locomotives | No power required, simple |
While our model trains climb a 2% grade, real trains use sand, banking, and more to conquer steep grades. The 2.2% grade in the Sierras is no match for these tricks. It’s a blend of engineering and physics, where sometimes the simplest solution is a handful of sand.
Design a “Most Efficient” Loop Challenge
Now we reach the grand finale. Forget reality for a moment. Your task is to design a theoretical loop—a literal loop-the-loop or a complex curve—that minimizes energy loss. This is the Iron Chef of railway engineering. Your ingredients are the principles we’ve dissected. Your judge is the unyielding law of physics.
The challenge has clear parameters. You must balance the critical curve radius against the inevitable grade. A tighter curve radius increases flange friction. A steeper grade demands more power. Your design must find the sweet spot where these forces cancel in the most elegant way. Think of it as compensated grade design pushed to its artistic limit.
Use everything from our sources. Apply the curvature and resistance math from engineering texts. Factor in the kinetic energy equations that define loss. Respect the practical limits of real steel on steel. Your goal isn’t just a loop that works. It’s a loop that works with ruthless efficiency.
How do you win? The design that loses the least energy to heat and sound is victorious. Physics keeps the score. A perfect curve radius minimizes lateral force. An ideal transition grade recaptures momentum. This is where theory meets a beautiful, friction-fighting machine.
So sketch your masterpiece. Calculate the trade-offs. Submit your most efficient path to the court of physical law. The winner isn’t the one who builds the biggest loop. It’s the one who designs the smartest one.
