Ever watched your N-scale locomotive struggle up a modest incline while your friend’s HO-scale freight rockets past like it’s late for dinner? Welcome to the fascinating intersection of gear ratio and drivetrain physics.
I’ve spent years watching modelers obsess over paint schemes and weathering details. Yet they’re genuinely baffled when their prized engine can’t haul three cars up a 2% grade. The culprit? They’ve ignored the fundamental relationship between motor rpm, reduction ratios, and wheel diameter.
Understanding gear train basics isn’t rocket science. It’s mostly multiplication and division. But this knowledge separates prototypical performers from expensive paperweights sitting on your shelf.
Think of this as your decoder ring for demystifying model locomotive performance. Just as track geometry affects why curves derail trains, mechanical advantage determines whether your model crawls realistically or disappoints spectacularly.
We’ll explore the actual calculations, provide real-world examples, and help you understand why that brass import outperforms everything else in your roster. No engineering degree required.
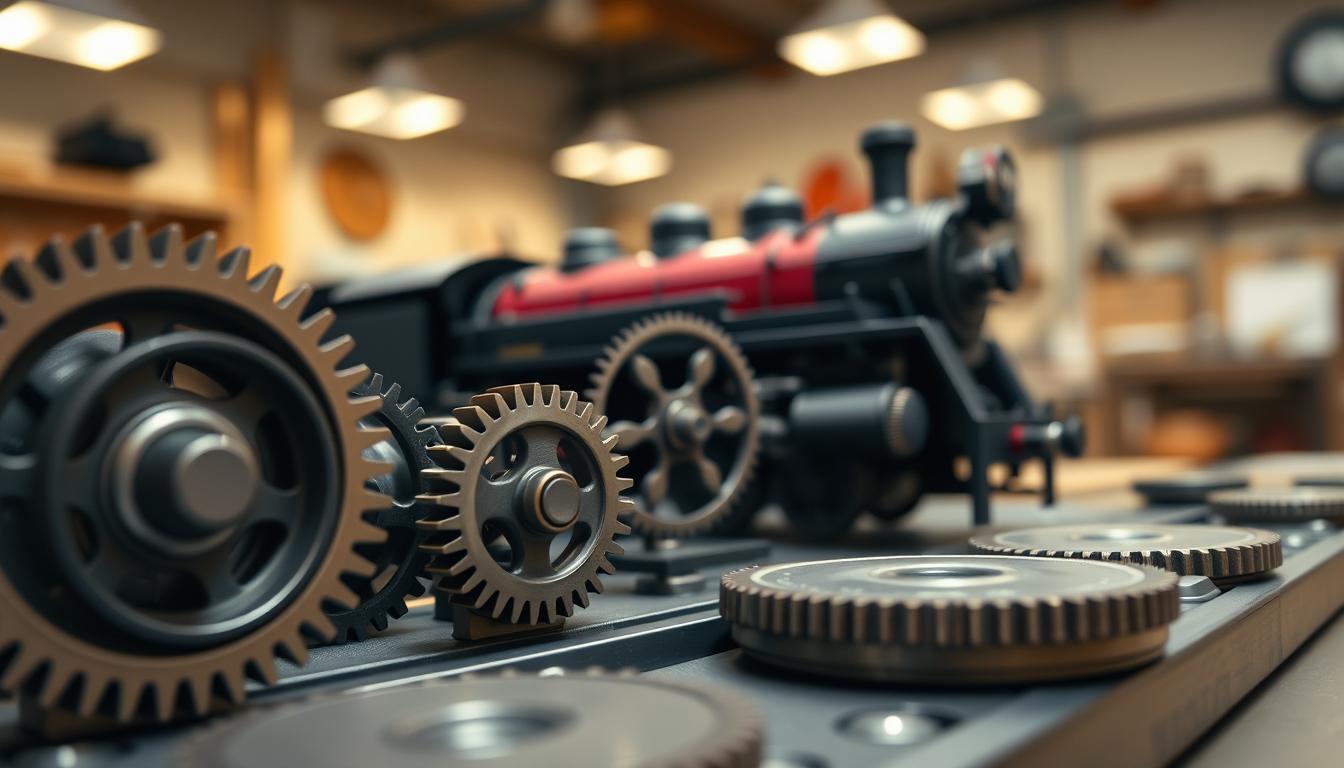
Gear ratio motor gear to axle gear multiply torque divide speed
Your locomotive’s gear ratio is more than a number. It’s the key to balancing speed and pulling power. The right gear ratio lets your model pull heavy loads up steep grades.
Calculating the gear ratio is simple. Just count the teeth on both gears and divide. The pinion gear (small one on the motor shaft) meets the drive gear (big one on the axle). Divide the driven gear’s teeth by the driver gear’s to find your gear ratio.
For example, if your motor has an 8-tooth pinion and a 32-tooth axle gear, you get a 4:1 ratio. This means the motor turns four times for every axle turn.
This ratio also boosts your torque by four times. So, even if the motor has weak twisting force, the axle gets a strong push.
This is mechanical advantage at work. It lets geared locomotives pull heavy loads, unlike direct-drive motors that stall easily. The gear teeth act like tiny levers, adding to the force.
But there’s a catch. While torque goes up, speed goes down. The pinion gear might spin fast, but the drive gear and wheels turn slower.
This trade-off shapes your locomotive’s character. For heavy loads, choose a higher ratio. For speed, pick a lower one.
The formula works for all model scales and makers:
- Gear Ratio = Driven Gear Teeth ÷ Driver Gear Teeth
- Torque Multiplication = Gear Ratio (through conservation of energy)
- Speed Reduction = 1 ÷ Gear Ratio
Knowing these relationships helps fix problems. If your Bachmann steamer can’t climb grades, it needs more torque. If it’s too slow, the gear ratio is too high.
Here’s a comparison of common gear ratios and their effects:
| Pinion Teeth | Axle Gear Teeth | Gear Ratio | Torque Multiplication | Best Application |
|---|---|---|---|---|
| 8 | 24 | 3:1 | 3x | High-speed passenger |
| 10 | 40 | 4:1 | 4x | General purpose |
| 9 | 54 | 6:1 | 6x | Heavy freight/switching |
| 8 | 72 | 9:1 | 9x | Mountain logging/steep grades |
The mechanical advantage principle works for any model, from cheap to expensive. It’s all about the gear teeth counts.
Understanding this concept lets you fix issues, improve existing models, and create custom gears. It’s the foundation of model locomotive mechanics.
Measure wheel diameter and rpm paper tach or phone app
Your workbench is where you test your ideas against real tools. Spoiler alert: your ideas usually don’t win. To figure out how well a locomotive works, you need to know two key things: wheel diameter and motor rpm. These aren’t easy numbers to guess or find in old specs.
Measuring wheel diameter is tricky. You can’t just measure the outside and call it done.
You need the effective diameter, which is where the wheel meets the track. The flange, the ring that keeps the train on track, doesn’t count. It’s there to help the train stay on the rails, not to help it move.
Digital calipers are your best tool for this job. They can measure down to 0.01mm. This might seem small, but it makes a big difference. A 0.5mm difference can change your calculations by over 4%.
Here’s a tip: measure multiple wheels on the same locomotive. They’re not always the same size. I’ve seen differences of up to 0.3mm. Average your measurements for better accuracy.
Now, let’s talk about getting rpm data from your motor. Old-school modelers used paper tachometers. They were strips of paper that created patterns when spun. They were charming but not very accurate.
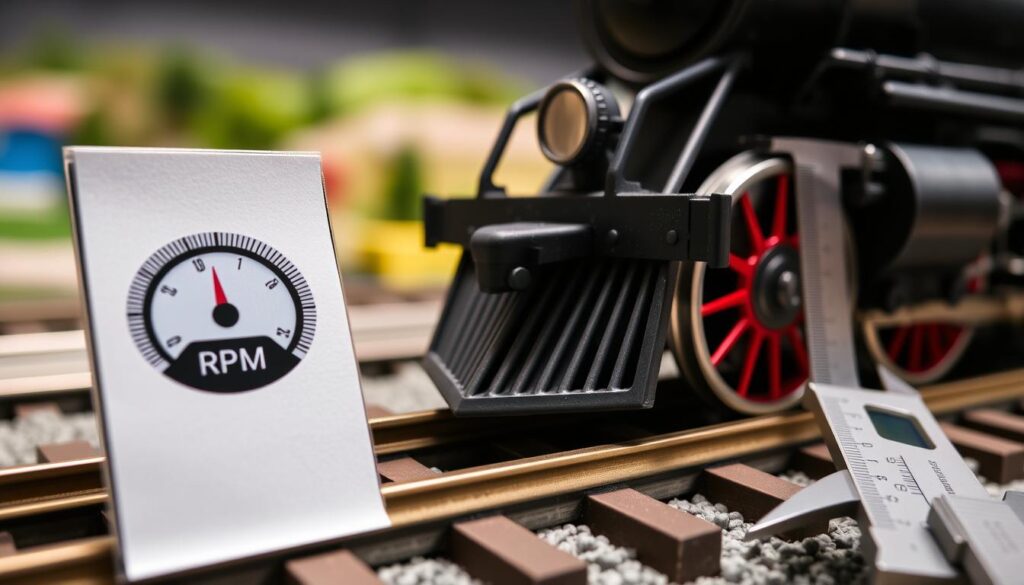
- Optical tachometer: Point and shoot at a marked shaft from a distance. No contact required, decent accuracy.
- Contact tachometer: Touch a small probe to the motor shaft. More accurate but requires access to the spinning component.
- Smartphone apps: Use your camera to count revolutions or analyze audio frequencies. Some apps detect flicker frequency in video of a shaft marked with reflective tape.
- Audio frequency detection: Apps that listen to motor hum and calculate RPM from the electromagnetic frequency signature.
My favorite tool? Smartphone apps that analyze video. They’re free, surprisingly accurate, and you probably already own the hardware.
Testing conditions are very important. Run your locomotive on a test stand, not on actual track. Why? Wheel slippage can mess up your data fast.
Measure at full throttle, but make sure to measure at the voltage you’ll actually use during operations. Not at maximum track voltage, unless that’s how you run your trains. For DC motors, rpm varies linearly with voltage. So, measure at 12V when you operate at 12V, not at the 18V your power supply can deliver.
The pitch diameter and pitch circle of your gears determine how they interact. For wheels, the diameter affects how far you travel per revolution. The formula is simple: circumference equals π times diameter. But you need accurate data for this to work.
This foundation is key for all your calculations. Get these measurement techniques right, and your predictions will be close to real-world performance. Mess them up, and you’re doing theoretical fiction. As they say in data science circles: garbage in, garbage out.
Record everything carefully. Make a spreadsheet with wheel diameter measurements, average values, motor shaft rpm at various voltages, and testing conditions. This will be your locomotive’s performance passport, the baseline for all future changes and troubleshooting.
For serious model railroad testing, consider getting quality digital calipers (around $20-30) and a dedicated optical tachometer (under $50). Smartphone apps are great for quick checks, but dedicated tools offer consistency and ease of use that justify the modest investment. Your measurements are the foundation of understanding how your locomotive really performs—not how you hope it performs, not how the manufacturer claims it performs, but how physics and engineering determine it will perform on your layout.
Compute theoretical top speed compare to measured value
With wheel measurements and rpm data, it’s time to figure out your locomotive’s top speed. This calculation combines motor rpm, gear ratio, wheel circumference, and scale conversion factors. It shows the theoretical limits and how your model railroad performs compared to engineering ideals.
The formula is simple: Speed = (π × Wheel Diameter × Wheel RPM) ÷ Gear Ratio. After calculating, you’ll convert units to get the speed in miles per hour. Every detail matters, and a small mistake can affect the whole calculation.
Let’s look at an example. Say you have an HO-scale diesel with 12mm diameter wheels. The motor spins at 16,000 rpm under 12V DC, and the gear ratio is 20:1. First, find the wheel rpm: 16,000 ÷ 20 = 800 rpm at the axle.
Then, calculate the distance traveled per revolution using the wheel circumference: π × 12mm = 37.7mm. Multiply wheel rpm by circumference: 800 × 37.7mm = 30,160mm per minute. Convert to meters per minute (30.16), then to kilometers per hour by multiplying by 0.06, giving you 1.81 km/h in model scale.
Apply your HO scale factor of 87.1: 1.81 × 87.1 = 157.6 scale mph. This is your theoretical maximum, assuming perfect efficiency and no friction. But, the real world isn’t perfect.
Now, put that locomotive on your track and run it at full speed. Time it over a measured distance and calculate the actual scale speed. I’m sure your real-world result will be 15-30% lower. Why the difference? Welcome to the world of friction.
Several factors can affect your top speed calculation:
- Gearbox losses: Friction between gear teeth can use up 10-20% of input power, turning energy into heat and noise.
- Wheel slippage: Even on perfect track, wheels slip a bit, losing 5-10% performance.
- Voltage drop: Track wiring resistance can lower the voltage your locomotive gets, reducing rpm.
- Motor efficiency curves: Motors work less efficiently outside their optimal rpm range, wasting energy.
Comparing theoretical calculations to real-world performance isn’t about failing math. It’s a diagnostic tool that shows mechanical inefficiencies. It helps you find which locomotives need maintenance. That brass import that always meets predictions? Quality gearing. That plastic locomotive underperforming by 40%? Time to check the gearbox.
| Locomotive Type | Theoretical Speed (scale mph) | Measured Speed (scale mph) | Efficiency (%) |
|---|---|---|---|
| Brass HO Diesel | 157.6 | 142.3 | 90.3 |
| Plastic HO Diesel | 157.6 | 118.2 | 75.0 |
| Premium N Scale | 189.4 | 170.5 | 90.0 |
| Budget N Scale | 189.4 | 132.6 | 70.0 |
The gap between prediction and reality tells a story. A 10% variance suggests excellent design. A 20-25% gap is typical for hobby-grade equipment. Anything over 30% needs attention—cleaning, lubrication, or gear replacement.
Testing on actual track gives real-world data that spreadsheets can’t match. Measured values account for many factors like track condition and temperature. Your theoretical top speed calculation sets the ceiling. Measured results show how close you can get.
Torque and tractive effort convert motor torque to rail force
Let’s talk about turning rotational force into pulling power. This is where physics meets the rail. Your motor creates torque, a twisting force measured in gram-centimeters or ounce-inches. But your locomotive doesn’t twist; it pulls.
The process of turning rotational force into linear pulling power involves two steps. First, your gears multiply the motor’s output. Then, your wheels turn that amplified force into forward thrust against the rail.
Here’s the elegant physics: Tractive Effort = (Motor Torque × Gear Ratio) ÷ Wheel Radius. This formula shows how many grams of pull you’re generating at each driven axle.
Think of it as a mathematical assembly line. Your motor delivers its torque. The gears multiply that value by the ratio you’re running. Then, you divide by wheel radius to find the actual force pushing your train forward.
The wheel radius is a common mistake. Larger wheels reduce tractive effort even when axle torque stays the same. This is why prototype steam locomotives made critical design tradeoffs.
Eighty-inch drivers on passenger engines are for speed, not hauling capacity. Forty-inch wheels on switchers are torque monsters, designed to yank loaded hoppers from dead stops.
Let’s look at a real example using typical HO scale numbers. Assume your coreless motor produces 15 gram-centimeters of torque at its shaft. You’ve installed a 20:1 gear ratio. Your driving wheels measure 6mm in radius (0.6 cm).
Step one: Motor torque (15 g-cm) × gear ratio (20) = 300 g-cm at the axle. Step two: Divide by wheel radius (300 g-cm ÷ 0.6 cm) = 500 grams of tractive effort per driven axle.
If your locomotive has two powered axles, you’re generating 1,000 grams total—enough to pull 10-12 HO boxcars on level track. Not bad for something that fits in your palm.
But wait. That calculation assumes 100% efficiency, which is laughably optimistic in the real world. Actual gearbox efficiency ranges from 70% to 85% depending on quality.
Your budget mechanism with sintered bronze gears and plastic bushings? Maybe 70% efficient, so your actual tractive effort drops to 700 grams. That precision-engineered brass import with ball bearings throughout? Closer to 85% efficient, delivering 850 grams of real pulling power.
This efficiency gap explains why locomotives with identical motors and gear ratios perform differently. The devil is in the gearbox details—bearing quality, gear mesh precision, lubrication, and manufacturing tolerances all steal force before it reaches the rail.
| Motor Torque (g-cm) | Gear Ratio | Wheel Radius (cm) | Theoretical TE (grams) | Actual TE at 75% Efficiency (grams) |
|---|---|---|---|---|
| 12 | 15:1 | 0.5 | 360 | 270 |
| 15 | 20:1 | 0.6 | 500 | 375 |
| 18 | 25:1 | 0.7 | 643 | 482 |
| 20 | 30:1 | 0.8 | 750 | 563 |
Understanding the relationship between motor specs, gear ratios, wheel geometry, and pulling power helps you diagnose issues. When someone claims their locomotive “has tons of torque,” you can now translate marketing hyperbole into actual gram measurements.
More importantly, you can predict whether that shiny new engine will haul your 25-car coal drag up your layout’s ruling grade. Or whether you’ll be adding helpers—which, let’s be honest, is sometimes the whole point of collecting multiple locomotives.
Grade math weight component F mg sinθ required TE
Understanding slope grade is key for serious modelers. When your train stalls on a scenic mountain, it’s not just physics being mean. It’s showing us the real force needed.
Gravity has two parts when your train climbs. One pushes down into the rails. The other pulls backward along the track, killing momentum.
The backward pull is F = mg sin(θ). Here, m is your train’s mass, g is gravity, and θ is the angle of incline. This formula shows how much force your locomotive needs to keep moving. No amount of wishing can change it.
For shallow grades, like 2% to 4%, we get a break. The small angle approximation makes sin(θ) ≈ tan(θ), which is just the grade percentage divided by 100. This turns complex trig into simple math.
A 2% grade means 2 feet of rise for every 100 feet of horizontal run. This creates grade resistance equal to 2% of your train’s weight. So, every 100 grams of train fights an extra 2 grams to move forward.
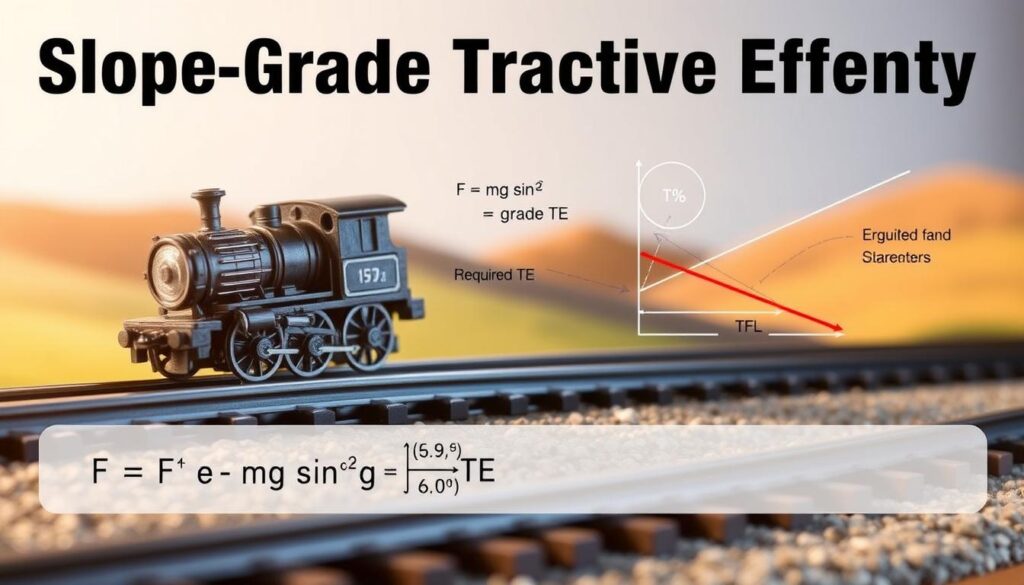
Let’s see how this works in real terms. Imagine a 20-car freight train weighing 2,000 grams total. On level track, it faces 40 grams of resistance. But add a 2% grade, and it’s fighting 80 grams of resistance.
This doubling effect is why grades are so tough. Your locomotive needs 100% more power for what seems like a small incline. This is why real railroads spent a lot to reduce grades.
The railroad industry has a rule: grade resistance in pounds per ton equals 20 times the grade percentage. A 2% grade means 40 pounds of resistance per ton. A 3% grade? That’s 60 pounds per ton. The numbers go up fast and hard.
Let’s look at how quickly physics gets tough:
| Grade Percentage | Resistance (lb/ton) | Additional Force per 1000g Train | Operational Impact |
|---|---|---|---|
| 1% | 20 | 10 grams | Minimal reduction in train length |
| 2% | 40 | 20 grams | Typical maximum for mainline |
| 3% | 60 | 30 grams | Helper district territory |
| 4% | 80 | 40 grams | Severe operational constraints |
Your total tractive effort combines three parts. Rolling resistance is first, usually 1-2% of weight. Then there’s grade resistance, calculated as we’ve discussed. If you’re accelerating, add the force needed to change velocity (mass times acceleration).
The formula is: Total TE = Rolling Resistance + Grade Resistance + Acceleration Force. On level track, you only fight rolling resistance. But start climbing and accelerating, and all three forces work against you.
Here’s the reality check. A locomotive making 800 grams of tractive effort can pull 30 cars easily on level track. But hit a 2% slope, and it might only manage 10-12 cars before slipping.
Double the grade to 4%, and you’re looking at 5-6 cars max. This is why mountain railroads used short trains with multiple locomotives. Physics left them no choice. The grade resistance calculation was more powerful than any president’s dreams.
Knowing these relationships changes how you design operating sessions. When someone boasts about their 4% model railroad grades, you know the operational compromises they’re making. Forget about realistic train lengths or consistent operation without overpowered locomotives.
The physics is tough but predictable. Grade resistance grows with both grade percentage and train weight. Master this, and you can tell if your locomotive’s poor hill-climbing is mechanical or just gravity’s math winning over your motor’s torque.
Experiment swap gears or motors record accel on flat and 2 percent grade
Watching your locomotive fail on a simple grade test can be humbling. Your spreadsheet and physics say it should work. But that 2% slope? It laughs at your assumptions.
Empirical data saves you from theoretical fantasy. Let’s design an actual experiment. It will tell you if your gear choices deliver real-world performance.
Building Your Test Track
Systematic performance testing starts with consistency. You need a controlled environment where only your chosen variables change.
Set up a 10-foot section of straight track with known-good electrical connections. Mark your starting and ending points clearly—painter’s tape works beautifully. Lock your power supply to a consistent voltage, typically 12V DC for standard operations.
This becomes your baseline testing ground. Every run happens here, under identical conditions, because inconsistent methodology produces worthless data.
Baseline Testing Protocol
Start with your stock configuration—whatever motor and gear ratio came with your locomotive. Place it at the starting mark, apply full throttle, and time how long it takes to reach the 10-foot endpoint from a standing start.
This measures acceleration performance. But here’s the critical part: run it five times and average your results.
Why five runs? Because physics includes random variation—a dust particle on the rails, slight voltage fluctuations, the butterfly effect. Averaging eliminates statistical noise and gives you reliable numbers.
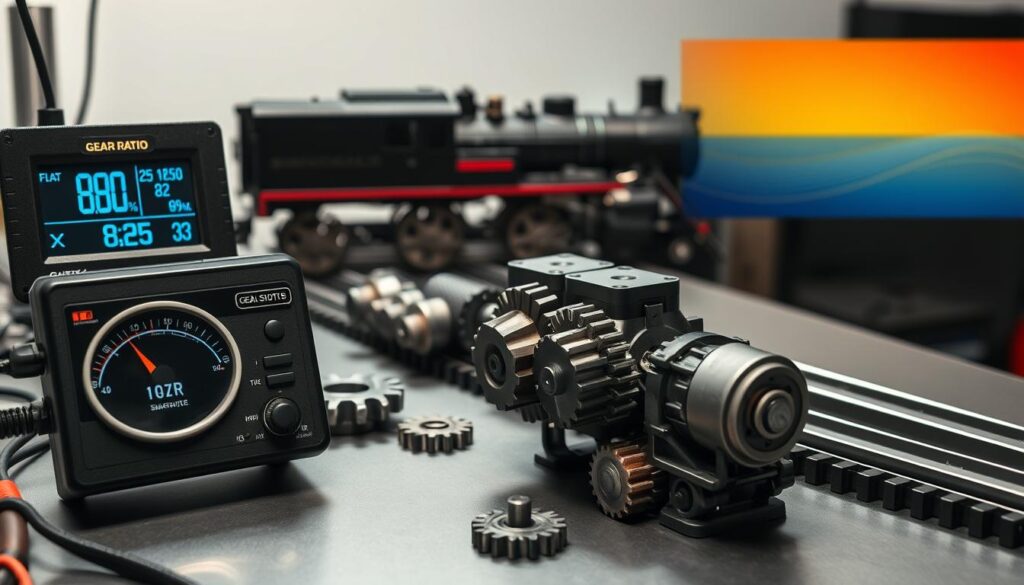
Record everything: gear ratio, motor specifications, voltage, average time, and observed top speed if your track is long enough. This becomes your reference point for every subsequent test.
Swapping Variables Systematically
Now change one variable only. Replace your 15:1 gear ratio with a 20:1 ratio. Keep the same motor, same voltage, same track conditions.
Run your five-test protocol again. You should observe improved acceleration testing times—the locomotive reaches that 10-foot mark faster during the launch phase. But if your track extends further, you’ll notice reduced top speed.
That’s the fundamental trade-off materializing before your eyes. Higher numerical ratios multiply torque at the expense of velocity. The math predicted it; your stopwatch confirms it.
Document your findings in a comparison table:
| Configuration | Gear Ratio | Average Time (seconds) | Top Speed (scale mph) | Notes |
|---|---|---|---|---|
| Baseline Stock | 15:1 | 2.8 | 65 | Standard performance |
| Torque Setup | 20:1 | 2.3 | 52 | Better launch, lower peak |
| Speed Setup | 12:1 | 3.4 | 78 | Slower start, high velocity |
| Different Motor | 15:1 | 2.5 | 68 | Higher RPM motor installed |
The Brutal Reality of Grade Testing
Level track is comfortable fantasy. Real layouts include grades. Install a 2% slope grade in your test section—that’s approximately a quarter-inch rise per foot of run.
Run your baseline configuration up this incline. Watch your acceleration testing times increase dramatically. That grade resistance we calculated in previous sections? It’s now observable, measurable reality.
Swap to your higher gear ratio and repeat the protocol. The improved torque from increased reduction should partially compensate for gravity’s punishment. You’ll see measurably better times compared to your baseline configuration on the same grade.
This is empirical proof that gear ratios matter beyond theoretical calculations. The difference between configurations becomes visceral when you’re watching locomotives struggle or succeed on actual slopes.
Real-World Examples
Tamiya Mini 4WD racers learned these lessons decades ago. Their 3.5:1 gear ratio setups prioritize speed—perfect for flat racing circuits where top velocity wins races. The 4:1 ratio configurations sacrifice peak speed for torque, excelling on tracks with elevation changes.
The performance difference isn’t subtle. A 3.5:1 setup might hit 30 mph on straightaways but bog down on a 3% grade. The 4:1 configuration tops out at 25 mph but climbs that same grade without hesitation.
Scale that up to model railroading, and you’re looking at the difference between a passenger locomotive that flies on level mainlines versus a freight hauler that conquers mountain grades with 40-car consists.
Advanced Testing Variables
Once you’ve exhausted gear ratio comparisons, start swapping motors while keeping gearing constant. Try a high-RPM can motor versus a torque-focused coreless motor. The behavioral differences will surprise you.
Test different wheel diameters too. Larger drivers change your effective gearing even when the actual gear ratio stays identical. Each variable teaches you something about the complex interplay between components.
Documentation: Your Secret Weapon
Create a spreadsheet. I know that sounds tedious, but empirical data without organization is just numbers. Track every configuration change, every timing result, every observation.
Include columns for:
- Date and test conditions (temperature affects motor performance)
- Motor type and specifications
- Gear ratios tested
- Wheel diameter
- Average acceleration times (flat and grade)
- Top speeds observed
- Qualitative notes (unusual sounds, vibrations, behaviors)
This database becomes invaluable when you’re planning future locomotive modifications or troubleshooting performance issues. You’ll know exactly what works because you’ve tested it, not just calculated it.
The difference between a modeler who understands their equipment and one perpetually confused? Testing, documentation, analysis, repeat. That’s the scientific method applied to miniature railroading, and it’s where theory transforms into mastery.
Efficiency losses gearbox friction wheel slip lubrication tips
Between theoretical torque and actual tractive effort lies a wasteland of friction, slip, and squandered energy. Your spreadsheet says one thing; your locomotive delivers another. Welcome to the reality of mechanical efficiency, where every component conspires to steal power from your motor before it reaches the rails.
Let’s confront the uncomfortable truth: gearbox friction is the primary thief in your drivetrain. Typical plastic gear mechanisms operate at 70-85% efficiency per stage. That means 15-30% of your motor’s output vanishes as heat and noise before the first wheel turns.
Most model locomotives use two-stage reduction with three gears total. Each mesh point generates friction losses through sliding contact between tooth profiles. Multiply these contact points across multiple stages, and the losses accumulate fast.
The difference between economy models and precision locomotives becomes obvious here. Quality manufacturers install ball bearings at every rotation point. Economy models rely on plain bronze or plastic bushings that create significantly higher resistance.
If your gearbox sounds like a coffee grinder, you’re hemorrhaging power.
Where Power Disappears: The Friction Map
Friction losses occur at predictable locations throughout your drivetrain:
- Gear mesh points – Involute tooth profiles generate sliding friction with each rotation
- Bearing surfaces – Plain bushings create substantially more resistance than ball bearings
- Axle interfaces – Contact between rotating shafts and stationary frames
- Motor commutator – Brush friction adds another efficiency penalty
- Wheel treads – Rolling resistance and occasional slip at the rail interface
Research on mechanical efficiency in small-scale systems confirms that cumulative losses in multi-stage mechanisms can exceed 40% under poor conditions. That’s nearly half your motor power transformed into waste heat.
Wheel Slip: The Invisible Energy Drain
Wheel slip represents situational efficiency loss that varies dramatically with track conditions. On clean track with proper contact, slip might hover around 2-5%. Introduce contaminants—dust, oil, oxidation—and slip increases proportionally.
The wheels spin faster than actual forward motion. Your carefully calculated speed predictions become fiction. You’re converting electrical energy into heat instead of useful work.
That locomotive struggling to start a train? It’s probably spinning its wheels while going nowhere. Wasted torque, wasted electricity, wasted effort.
The Lubrication Paradox: Too Much, Too Little, Just Right
Now for the controversial topic that divides modelers: how much lubrication is enough? Metal-on-metal contact without lubrication wears gears rapidly and increases friction catastrophically. But over-lubrication creates equally serious problems.
Excess grease generates viscous resistance in small mechanisms where surface tension dominates. Worse, excess lubricant migrates onto wheels and rails, causing the wheel slip problems mentioned above. It also attracts airborne dust that forms an abrasive grinding compound.
| Lubrication Approach | Friction Impact | Contamination Risk | Long-term Result |
|---|---|---|---|
| None (dry running) | Extremely high friction | Low contamination | Rapid wear, eventual failure |
| Minimal synthetic oil | Optimal friction reduction | Very low risk | Excellent performance, minimal maintenance |
| Moderate plastic grease | Good friction control | Moderate risk if excess | Good performance with periodic cleaning |
| Heavy grease application | High viscous resistance | High migration and dust attraction | Degraded performance, frequent cleaning needed |
Practical Maintenance Procedures That Actually Work
The solution demands a minimalist lubrication strategy as part of your regular maintenance procedures. Apply one tiny drop of synthetic oil or a microscopic dab of plastic-compatible grease at each bearing point. Clean excess immediately with a cotton swab.
Use proper lubricants designed for model mechanisms. Never use household oils containing solvents or additives that attack plastics. Many modern gearboxes run happily with minimal or no lubrication if they’re precision-molded from self-lubricating engineering plastics.
Here’s your practical maintenance checklist:
- Inspect gearboxes quarterly – Remove trucks and examine gear condition
- Clean contaminated mechanisms – Use isopropyl alcohol and soft brushes
- Reapply lubricant sparingly – Less is genuinely more in small mechanisms
- Test wheel resistance – Spin wheelsets by hand; they should rotate freely
- Monitor performance changes – Track pulling capacity over time as an efficiency indicator
If that locomotive that used to pull 20 cars now struggles with 15, suspect efficiency losses from contaminated gears or dried-out bearings. Address the actual mechanical condition, and you’ll discover many “weak” locomotives simply needed proper maintenance procedures.
The Quality Equation: Bearings Make the Difference
Quality bearings significantly improve mechanical efficiency compared to plain bushings. A locomotive with ball bearings at every rotation point can achieve 85% overall efficiency. The same gear ratio with plastic bushings might deliver only 65% efficiency.
That 20-percentage-point difference translates directly to pulling power and top speed. It’s why premium models outperform economy locomotives with identical motors and gear ratios.
Efficiency matters enormously in these tiny mechanisms where power margins are slim. Understanding where energy disappears helps you identify improvement opportunities and explains why real-world performance rarely matches theoretical calculations. Master these efficiency factors, and your predictions will align with reality.
Design a freight vs passenger gearing solution tradeoffs
Choosing the right locomotive starts with a simple question: what job will it do? Your answer decides between a gear ratio for pulling power or speed. You can’t have both at their best with one setup.
Higher gear ratios increase torque but lower speed. For example, a 25:1 ratio means the motor spins 25 times for each wheel. This gives great pulling force but limits top speed.
A 12:1 gear ratio cuts motor revolutions in half. This lets your locomotive reach high speeds over 100 mph. But hauling a heavy train up a steep grade shows the need for more torque.
Real railroads knew about this trade-off. Freight trains needed tractive effort for heavy loads. Starting a 15,000-ton train and climbing steep grades required lots of torque, not speed.
Passenger trains needed speed. They were lighter, had faster schedules, and followed easier routes. This was based on real operational planning.
Choose the right gear ratio for your layout. Decide what each locomotive needs to do before buying or modifying. For mountainous areas, use high reduction ratios.
For mountainous areas, use 22:1 or 25:1 gearing. This means slower top speeds, but it’s realistic for coal trains. They didn’t run fast, so you gain realism and solve a mechanical challenge.
For level tracks, use lower gear ratios. A 12:1 or 15:1 ratio is best for speed. You’ll have less tractive effort, but passenger trains don’t need as much power.
Modern model locomotives are adaptable. Many can change gear ratio easily. You can have two sets for different jobs: freight for heavy hauls, passenger for mail trains.
This might seem obsessive. But it’s about making your layout realistic. You can explain why certain trains are used for specific jobs. It’s not just random.
| Service Type | Recommended Gear Ratio | Torque Priority | Top Speed (Scale MPH) | Typical Application |
|---|---|---|---|---|
| Heavy Freight | 22:1 to 25:1 | Maximum | 50-60 | Coal drags, helper service, mountain grades |
| Road Freight | 18:1 to 20:1 | High | 65-75 | Manifest trains, intermodal, moderate grades |
| Mixed Service | 15:1 to 17:1 | Moderate | 75-85 | Local freights, branch line passenger |
| Passenger Express | 12:1 to 14:1 | Low | 90-110 | Limited trains, mail service, level routes |
Your layout’s features should guide your decisions. For short trains on flat tracks, choose speed. For long trains on steep tracks, choose tractive effort.
Want both? Buy different locomotives for each job. This is what real railroads do. They match the right tool to each task.
This approach shows you’re serious about prototype modeling. You’re not just running trains. You’re using engineering to match performance with needs, just like real railroads have for over a century.
Worksheet with solved examples
Real numbers make math real. Imagine a HO scale diesel with a 24:1 gear ratio and 11mm wheel diameter. It runs at 14,000 rpm.
Divide the motor speed by the gear ratio to find the wheel speed: 583 rpm. Then, multiply this by the wheel circumference (34.6mm). You get 72.6 meters per hour, or 63 mph. This is great for freight.
Now, let’s talk about tractive effort. The motor has 18 gram-centimeters of torque. Multiply this by the gear ratio to get 432 g-cm at the axle.
Divide by the wheel radius (5.5mm) to find 785 grams per powered axle. Two axles give 1,570 grams. But, real gearbox efficiency reduces this to about 1,256 grams of actual pulling force.
What does this mean on a slope grade? It’s simple. Divide the tractive effort by the train weight. Subtract rolling resistance (450g for a 30-car train).
Your locomotive can handle a 2.7% grade with that train. This shows it has enough power for reliable service.
These examples aren’t just theory. They’re tools for diagnosing problems. If performance is off, work backward through the numbers.
Look at the difference between predicted and actual results. This shows where power loss comes from. Practical applications of gear ratio math turn guesswork into precise engineering.
