
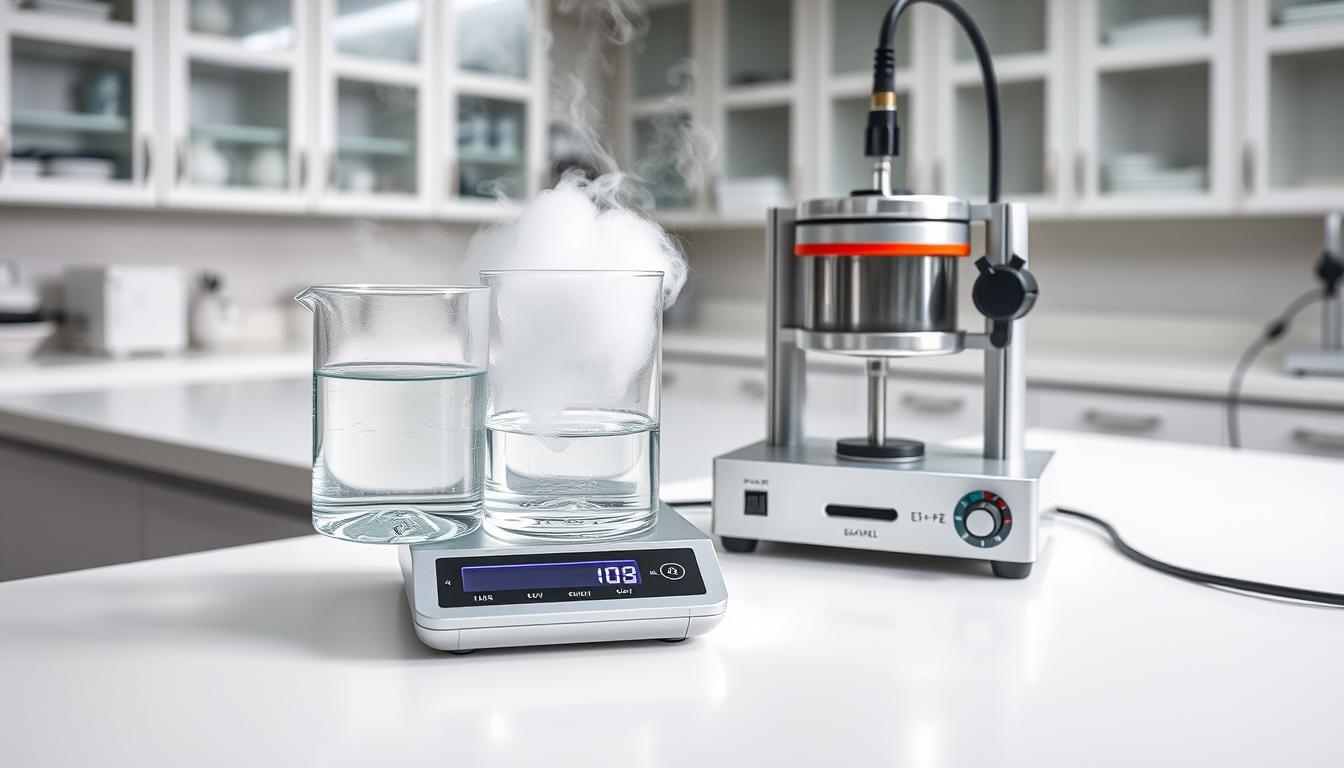
Welcome to a place where thermodynamics and modern measurement meet. It’s not about Victorian-era nostalgia. It’s about energy transfer with a modern twist.
Condensing vapor in water is more than a trick. It shows the secrets of energy change.
Steam calorimetry turns boiling water into valuable data. Each joule shares a story about specific heat and latent energy.
We mix old industrial ideas with today’s precision. It’s about learning through controlled chaos.
This isn’t just science. It’s about understanding energy’s beauty through boiling water. Are you ready to uncover its secrets?
Safety Controls & Instructor‑Only Tasks
Steam experiments are not just for TikTok. They involve real science and safety. We’re talking about the latent heat of vaporization, a powerful force that needs careful handling.
Do you remember that time someone tried to fix a steam generator in class? It ended with a fire extinguisher getting used. This is why we have rules in science clubs. These rules keep learning safe and fun.
Your temperature probe is more than just a tool. It’s a way to check if your experiment is working right. It’s key when you’re dealing with big changes in energy.
Here’s what everyone needs to know about safety:
| Safety Protocol | Student Responsibility | Instructor-Only Task | Rationale |
|---|---|---|---|
| Steam Generation | Monitor equipment from safe distance | Control steam release valve | Prevents pressure buildup accidents |
| Insulation Handling | Report damaged insulation immediately | Install and inspect all insulation | Avoids burns from escaping steam |
| Emergency Shut-off | Identify shut-off locations | Execute emergency procedures | Quick response prevents escalation |
| Data Collection | Record measurements | Position and calibrate temperature probe | Ensures accurate energy transfer data |
Why are we so strict? Water’s change of state has a lot of energy. This energy can be dangerous if not handled right. The latent heat of vaporization is hidden until it’s released, often in a big way.
Instructors aren’t just bosses. They keep things safe and controlled. They make sure everyone learns without getting hurt. They know steam is serious business, not just for social media.
Your temperature probe is like a witness. It shows numbers, but instructors understand what those numbers mean. They know if things are safe or not.
Some experiments are better left to experts. That’s why instructors do certain things. They make sure science is safe and fun for everyone.
Apparatus: Insulated Cup, Probe/Logger, Known Mass of Steam (Condensate)
Meet the stars of our thermal show—three key tools that turn guesses into facts. This isn’t your grandma’s simple kitchen test; we’re creating the iPhone Pro of thermodynamics here.
The insulated cup is our hero, keeping heat in like a bouncer at a club. It’s not just any cup; it’s a thermal shield that makes sure every bit of energy is tracked.
Then, there’s the temperature probe and data logger, your digital detective for heat mysteries. This duo records temperature changes with almost perfect detail. Say goodbye to manual readings; this is where data logging turns our experiment into a precise art.
Lastly, the known mass of steam—no room for guesses here. We measure condensate mass with the care of a jeweler weighing diamonds. This is what makes steam calorimetry top-notch, not just a guess.
This setup is like upgrading from basic coffee cup tests to a high-tech tool. It’s like switching from an abacus to a supercomputer—same math, but with data logging that would impress James Joule himself.
Each piece is vital in this thermal orchestra. The insulated cup holds, the probe senses, the logger logs, and the measured mass is the key for our math. Together, they turn steam into valuable scientific knowledge.
Procedure: capture condensing steam in water, log temperature rise
Get ready to turn your lab bench into a thermal stage. Here, water is both the hero and the villain. It’s not just about popping popcorn—it’s about precise science where every degree matters.
Place your insulated cup like it’s the VIP area. The probe is your ticket to the thermal show. We’re about to see steam’s phase-change magic.
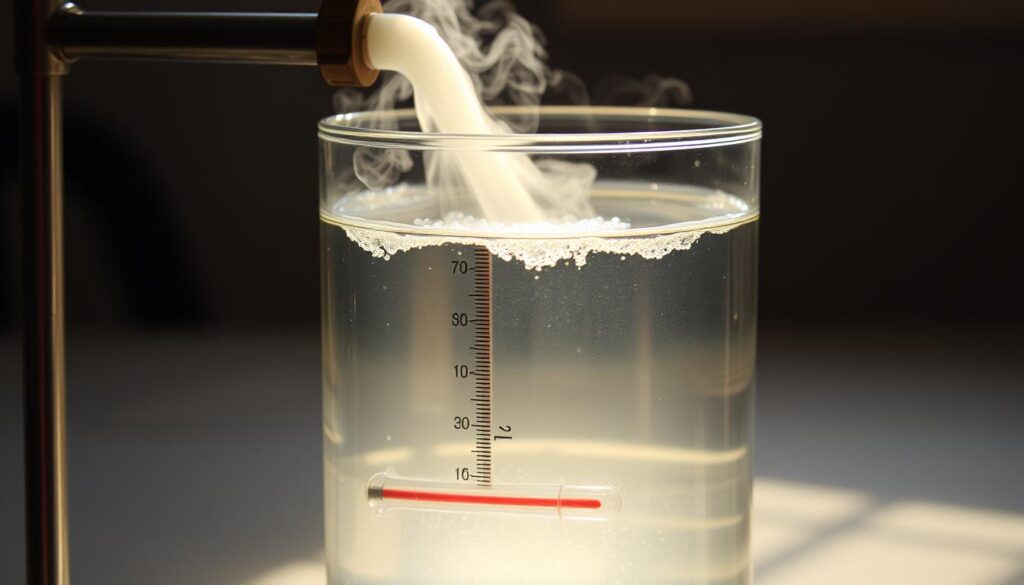
Start the steam flow into your cup filled with water. Those swirling vapors are not just for show. They carry energy, showing off the latent heat of vaporization.
Begin logging the temperature right away. Your data logger is like a journalist, documenting this thermal event. See the numbers go up like a stock market bubble—it’s meaningful.
Notice the temperature rise and then pause? That’s water being dramatic, balancing between specific heat and phase change. It’s like deciding whether to heat up or change form.
Keep going until the temperature stops rising. That’s when your experiment gets its standing ovation. You’ve measured energy transfer with the flair of a Broadway show.
Every data point is a clue. The rise shows specific heat at work. The pause is for latent heat to take a bow. Together, they explain why steam burns are so bad—water holds onto energy well.
Calculations: specific heat vs latent heat, error sources
Welcome to the financial district of thermodynamics. Here, we deal with joules and entropy, not stock prices. Your steam calorimetry experiment turns into beautiful math.
Think of specific heat versus latent heat like daily calories versus burning fat. Specific heat is your daily energy use. Latent heat is the cost of changing phases, like melting ice or boiling water. Both are important but in different ways.
Your mission is to find the latent heat of vaporization. Use this equation:
m_steam × L = m_water × c_water × ΔT
This equation helps you find L, the latent heat. It’s about balancing energy. The mass of steam times latent heat equals the mass of water times specific heat times temperature change.
Data logging is your ally. Those temperature curves are not just pretty. They help spot errors in real-time. The slope shows heat transfer rates, and plateau points show equilibrium.
But, there are errors to watch out for. That cup without insulation? It’s losing data fast. Your steam calorimetry setup might lose heat quickly, like a startup with no money.
| Error Source | Impact on Results | How to Minimize |
|---|---|---|
| Heat loss to environment | Underestimates latent heat | Better insulation, shorter experiment time |
| Incomplete condensation | Mass measurement errors | Proper steam capture technique |
| Temperature lag | Time delay in readings | Faster response probes, calibration |
| Scale precision | Mass measurement uncertainty | Use more precise weighing equipment |
| Steam quality issues | Impure steam affects results | Ensure clean water source, proper boiling |
This table is your guide to better science. Notice how losing heat to the environment is a big problem? That’s why you need to log the whole temperature curve, not just the peak.
When you analyze your results, calculate percentage errors well. Compare your latent heat value to the accepted one. If the difference is more than 10%, find out which error source is the main problem.
Good steam calorimetry is about understanding why results are imperfect. Your data logging equipment helps you figure out what went wrong and how to improve next time.
So, accept errors as learning chances. They’re not mistakes but opportunities to learn. Now, go calculate like the thermodynamic detective you are!
Graphing & Modeling: fit curves, estimate losses
Your data points aren’t lonely islands—they’re trying to tell a thermal story. Think of graphing as translating this energy narrative into visual poetry.
Curve fitting isn’t about connecting dots like a child’s coloring book. It’s more like finding the perfect dating app match for your data. The right curve reveals hidden relationships the naked eye would miss.
Your temperature probe becomes Sherlock Holmes here, sniffing out heat leaks with detective precision. It tracks where energy escapes the system, revealing the experiment’s dirty little secrets.
Modeling heat loss requires Swiss watchmaker accuracy. Approximations are for amateurs—we’re building mathematical masterpieces here.
Remember that specific heat calculation from earlier? It’s your baseline for spotting discrepancies. When actual results diverge from theoretical predictions, your model exposes the energy thieves.
Fit your curves with analytical rigor but creative flair. The best models blend science with artistry—less Picasso, more forensic accountant.
This isn’t just about pretty graphs. It’s about uncovering truth hidden in temperature gradients and energy transfers. Your temperature probe data holds the clues—your job is to interpret them like a seasoned detective.
Discussion: power plant relevance, efficiency limits
That beaker of steaming water you just experimented with? It’s like a tiny version of your local power plant’s daily battle. They’re working hard to keep the lights on for whole cities. We’re just measuring temperature changes that would make a thermostat blush.
The real magic—and the real headache—lies in that latent heat of vaporization. It’s like trying to get a teenager out of bed: lots of energy input with little immediate result. In power generation, this phase change energy is the difference between making money and losing it.
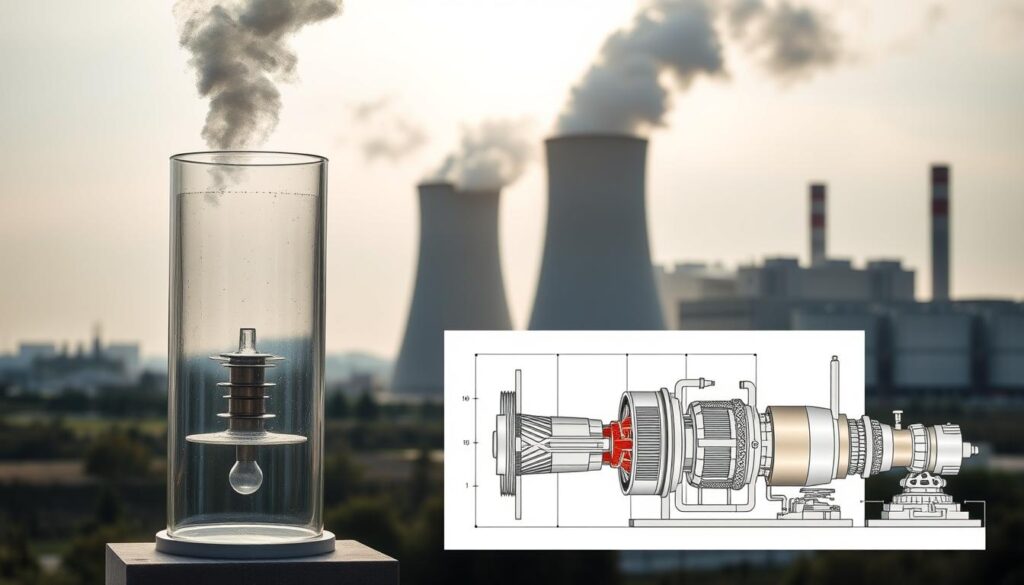
Our steam calorimetry experiment shows the big challenges of power generation. Those energy losses we calculated? Multiply them by millions and you see the reality every plant manager fears on Monday mornings.
Efficiency limits aren’t just ideas—they’re why your electricity bill has so many decimal points. The quest for perfect energy conversion is like chasing thermodynamic unicorns: beautiful but impossible.
Let’s talk about corporate greenwashing. That “carbon neutral” label on your energy bill? It often means they’ve hidden inefficiencies with creative accounting. Our experiment shows the truth: energy transformation is messy, lossy, and imperfect.
Here are three harsh realities for power plants:
- Latent heat requirements never negotiate—they’re the thermodynamic mob
- Efficiency plateaus hit harder than a Monday morning without coffee
- Perfection costs more than the energy you’re trying to save
The takeaway? Our little lab experiment isn’t just for show. It’s a small version of the drama in every steam turbine. The latent heat of vaporization decides if we’re making progress or just wasting money.
Differentiation & Student Roles
Think of this lab like a heist movie. Each crew member has a special skill for the perfect job. Instead of cracking safes, we’re learning about latent heat.
The Data Logger is like a detail-focused archivist. They record every temperature change with great care. It’s not just data logging. It’s telling the story of heat transfer.
The Temperature Probe Operator is the hands-on expert. They connect theory to real-world action. Watching them use the temperature probe is like seeing a musician find their groove. Suddenly, complex ideas become clear.
The Analyst is the detective. They connect the dots between steam and temperature. They ask “why” while others measure “what.”
This way of learning makes everyone feel important. Each student uses their strengths to learn. It shows that in science, just like in heists, teamwork is key.
Lab Report Template & Rubric
Think of your lab report as a scientific thriller. Your hypothesis is the plot twist. Your data are the colorful characters. And your conclusion is the satisfying resolution.
Here’s how to structure your masterpiece without sounding like a robot:
Introduction: Set the stage like a Netflix documentary opener. Explain why specific heat matters. What’s the drama behind latent heat of vaporization? Make us care about thermal energy transfer.
Methods: Write this like you’re explaining a recipe to a friend. Use simple language. We’re measuring energy transfer, not writing Shakespeare.
Results: This is where your numbers become the heroes of the story. Present your temperature changes and mass measurements clearly. Show how you calculated specific heat and uncovered the secrets of vaporization.
Discussion: The Oscar acceptance speech of your report. Connect your findings to the real world. Did your calculated latent heat values match expectations? Why might specific heat calculations differ from theoretical values?
Now for the rubric – your scientific storytelling scorecard:
- Clarity (30%): Could a smart eighth grader follow this? Good. Could your grandma? Even better.
- Data Analysis (40%): Did you properly calculate specific heat and latent heat of vaporization? Show your work like a proud parent shows baby photos.
- Critical Thinking (20%): Did you question your results? Discuss error sources? That’s the difference between regurgitation and actual science.
- Presentation (10%): Neat tables, proper graphs, and actual paragraphs. Because nobody likes reading a wall of text.
Remember: great lab reports don’t just present data – they tell a compelling story about energy transformation. Your specific heat calculations are the climax, and your vaporization insights are the dramatic reveal.
Write like you’re explaining your experiment to someone who’s genuinely curious, not like you’re trying to impress a thesaurus. The best science communicates complex ideas simply – think Bill Nye, not academic journal.
Cleanup & Reflect
Cleanup isn’t just about wiping down tables. It’s about unwinding after a deep dive into data. Treat that temperature probe like it’s priceless. Mishandling it now could undo all your hard work.
Securely pack your data logging equipment. Neglecting it is like messing up the final play. It’s that important.
Reflection is where learning really happens. What went wrong in your experiment? Did you have a breakthrough in thermodynamics? Think of it like debriefing a mission.
True learning comes from both doing and thinking about what you did. It’s a chance to learn from every moment, no matter how steamy.
Your data logging might show some quirks. But that’s okay. Analyze those curves like you would a game breakdown. Did your temperature probe behave as expected? Or did it surprise you?
Embrace the chaos. That’s where the real insights are hidden.
