
Forget the chalkboard equations. The ideal gas law isn’t just a string of symbols in a textbook. It’s the force that can make a column of water dance. Yet, for too many students, it’s a sterile theory, a set of variables on a page. What if you could see pressure? What if you could build the instrument that makes the invisible force of a gas not just calculable, but visible?
We’re not just talking about pressure measurement. We’re talking about building a bridge. This is about connecting the abstract world of P1V1/T1 = P2V2/T2 to the tangible, sloshing reality of a water column. This is where theory gets its hands dirty. We’re constructing a U-tube manometer, the same fundamental tool an engineer uses to gauge pressure differences. It’s the physical proof that the equations are real.
This isn’t a sterile lab exercise. It’s an act of translation. You’re not just connecting tubes and water; you’re connecting the abstract to the physical. You’re taking the concept of force per unit area and making it rise and fall in a clear, plastic tube right before your eyes. This is how you make a concept feel real. You’re not just learning about pressure; you’re building the gauge that defines it.
So, let’s move beyond the textbook diagram. Let’s stop just solving for P and start building the tool that defines it. Are you ready to see pressure in a whole new light?
How a Manometer Works (pressure ↔ fluid height)
Every manometer is a conversation between pressure and a fluid column, with gravity as the judge. Before digital tools, we used a pressure gauge to measure pressure. It shows the invisible force as a visible height.
Imagine a scale that shows the truth. On one side, you measure pressure. On the other, a liquid column. When you apply pressure, the liquid moves up the other side. The higher the pressure, the higher the liquid goes.
The difference in height shows the pressure. It’s like a fluidic tug-of-war, with the fluid column as the scorekeeper.
The magic is in the equation: P = ρgh. P is the pressure you’re solving for. ρ is the fluid’s density. g is gravity. And h is the height difference. More pressure means a greater height difference.
This manometer measures gauge pressure. It shows pressure relative to the atmosphere. Absolute pressure is different, including the atmosphere’s weight.
Archimedes would be proud. This isn’t complicated. It’s a simple balance. You’re seeing the law that pressure applied to a fluid is transmitted equally in all directions.
Choosing Your Fluid: The Working Fluids of Manometry
The fluid you choose is your instrument’s “sensor.” Each has pros and cons, based on its density. Water is common but has a low density, making it easy to read. Oil is more viscous and can dampen fluctuations. Mercury is traditional but dangerous and should be avoided.
| Fluid | Density (kg/m³) | Typical Use | Safety & Practical Notes |
|---|---|---|---|
| Water (colored) | ~1000 | Classroom demos, low-pressure systems | Safe, cheap, visible with dye. Large height changes per unit pressure. |
| Light Oil (e.g., Mineral Oil) | ~800-900 | Industrial, HVAC | Less evaporation than water, dampens oscillations. |
| Mercury (Hg) | ~13,500 | High-precision labs (historical) | TOXIC. AVOID. Vapor is hazardous. Not for classroom use. |
| Isopropyl Alcohol (dyed) | ~790 | Educational, low-pressure | Evaporates quickly, but shows meniscus clearly. |
You’re not just connecting tubes and filling them with colored water. You’re building a direct, analog computer that solves for P. It’s a balance, a see-saw, a simple machine that trades the invisibility of pressure for the visibility of a fluid height. And in the next section, we’ll get our hands dirty with the shopping list to build just that.
Materials & Tools: Your Hardware Store Haul
Forget the fancy lab equipment. Making a manometer is more about smart, simple engineering. It’s like building a sundial, focusing on function over looks. You can find everything you need at the hardware store for a few bucks.
The basic idea is simple. Pressure on one side of the tube pushes the manometer fluid down. This makes it rise on the other side. The difference in height shows the pressure. This idea has been around for centuries, but we’ve added some modern touches.
The Shopping List for a Homebrew Pressure Gauge
This isn’t for a NASA project. It’s a simple list from the hardware store. You’re looking for creativity, not fancy materials.
Below is a list of what you need. It’s like a checklist before you start building.
| Component | What it is & Why You Need It | Pro-Tip / Hack |
|---|---|---|
| Clear Vinyl Tubing (10 ft, 1/4″ ID) | The heart of your U-tube. Clarity is key—you need to see the fluid level clearly. | Hardware store aquarium tubing works. Avoid kinked or cloudy sections. |
| Food Coloring & Water | Your manometer fluid. Water is safe, visible, and cheap. The dye makes it pop. | Use a dark color like blue or red for maximum contrast against a white backing. |
| Rigid Backing Board | A straight 1″x2″ wood strip, a paint stir stick, or a long ruler. This is your “dashboard.” | Must be rigid and straight. A warped board will ruin your pressure gauge calibration. |
| Fittings & Adapters | Barbed adapters, T-connectors, and caps. This is where you MacGyver it. | A 2L soda bottle, a two-hole stopper, and some tubing can replace the pneumatic cap from the university lab sheet. |
| Zip Ties & Double-Sided Tape | Your assembly and mounting hardware. Low-tech, but mission-critical. | Use clear zip ties to secure the tubing to the backing board without obstructing the view. |
| Ruler or Measuring Tape | For marking your backing board’s measurement scale. Accuracy is your friend. | In a pinch, print and laminate a paper ruler and tape it on. Function over form. |
The beauty of this setup is its simplicity. The U-tube doesn’t need fancy tech. It works on basic physics. Your task is to make a clear, reliable tool for measuring pressure. This list is your first step in pressure gauge calibration on a budget. It shows that the simplest engineering is often the most elegant.
Step-by-Step Build with Photos/Diagrams
Forget IKEA instructions—this is where your DIY manometer project gets real. We’re leaving the world of theory and entering the realm of physical creation. This isn’t about following a paint-by-numbers guide; it’s a physics experiment in the making. Let’s get our hands metaphorically dirty.
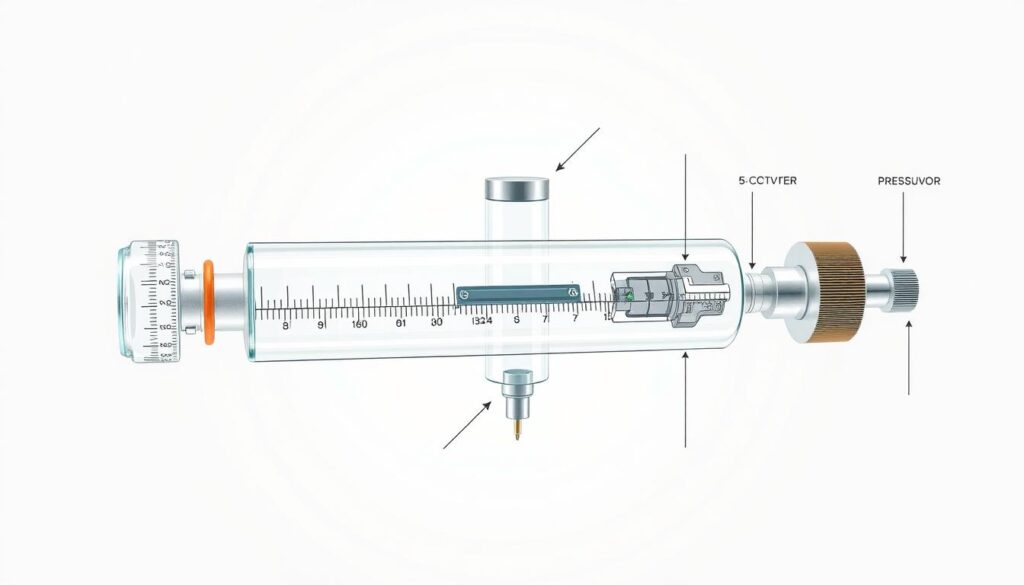
Before we start, a word to the wise: this isn’t assembly-line work. Think of it less like following a recipe and more like a mad scientist’s weekend project. The goal is a functional, reliable manometer tube that won’t leak, topple, or give you a false reading at the critical moment. We’ll build this in three key steps.
The Build in 5 Steps
Don’t let the number fool you—some of these are two-part maneuvers. Think of it as building a small, liquid-filled instrument with your own hands, where precision and patience are your best tools.
Step 1: The Backbone
Your first task is to create the physical framework. This isn’t just about sticking a tube to a board; it’s about creating a stable, plumb, and true foundation for your entire pressure sensor system. Start by securing your board—a simple 1×4 or a similar plank of wood works perfectly. The board is your canvas, and your manometer tube is the brush.
Take your clear, flexible tubing and carefully form a “U” shape against the board. This is the heart of your device. The key here is verticality. Use a level or a simple plumb line (a string with a weight) to ensure the board and the planned path of your tubing are perfectly vertical. A tube that leans is a manometer that lies. Secure the tube to the board at the top and bottom of the “U” with strong, clear tape. This is your static framework—the silent, structural hero of the operation.
Step 2: The U-Tube Assembly
Now, the magic happens. You have your U-shaped manometer tube affixed to the board. The next act is introducing the manometer fluid. This is where you must choose your potion: colored water is the classic, but you can experiment (more on that later). Using a funnel, carefully pour the fluid into one side of the U-tube. The goal is to get the fluid to settle at roughly the same level in both arms when the system is at rest and open to the atmosphere.
This is the first test of your assembly. If the levels are perfectly equal, you’ve built a level, airtight system. If not, you might have a leak, a kink, or a mischievous air bubble. This step is where your device transforms from a piece of plastic tubing into a pressure sensor. Watch the fluid levels dance—it’s the first sign of life in your creation.
Step 3: Sealing the Deal
This is the moment of truth. The interface between your manometer and the pressure source (like your reaction bottle) is the most critical juncture. A leak here dooms the entire experiment. This is where your “Two-Way Cap” or a simple rubber stopper with two holes comes in. One port connects to your pressure source, the other to your manometer tube.
Use a high-quality, flexible tubing for the connection to your pressure source. Apply a small amount of plumber’s tape to the threads or a dab of silicone sealant (food-grade, if you’re using it for chemical reactions) to the connection points. This isn’t overkill; it’s the difference between a precise measurement and a frustrating puddle of manometer fluid on your bench. Tighten, check for hisses with a soapy water solution, and you’ve just built a pressure sensor.
Here’s a quick reference for common manometer fluids and their properties to consider:
| Fluid Type | Density (g/mL) | Visibility | Best For |
|---|---|---|---|
| Water with Food Coloring | 1.00 | Excellent (with dye) | Classroom demos, low-pressure systems |
| Mineral Oil | ~0.8 | Good | General use, less evaporation |
| Rubbing Alcohol (dyed) | 0.79 | Good | Where fast fluid movement is needed |
With the fluid in place and the connections sealed, your manometer is no longer just a science project. It’s a calibrated instrument, a liquid ruler for measuring the invisible force of pressure. The manometer tube is now a window into the forces at play, waiting for the first pressure change to tell its story.
Calibrating Zero and Checking for Leaks
Before we can trust this glass-and-water contraption with actual science, we must perform the sacred ritual of establishing zero. Think of it as the instrument’s baptism—its moment of transition from decorative tubing to legitimate measurement device. Without proper manometer calibration, you’re just admiring colored water in a U-shape.
The zero point is your baseline. It’s the pressure equivalent of sea level on a topographical map. With both ends of your U-tube open to the atmosphere, the fluid columns should sit at exactly the same height. This equality represents atmospheric pressure balancing itself.
If your fluid levels don’t match, don’t panic. You’re not facing a physics crisis. The culprit is usually one of three issues:
- Your mounting board isn’t perfectly vertical
- The tubing has a slight kink or restriction
- Your “water” isn’t pure (dye concentration varies)
Adjust the board until those fluid meniscuses line up. This is your true zero, the reference point for all subsequent measurements. Proper pressure gauge calibration begins right here.
Now for the leak test—the difference between a working instrument and an expensive paperweight. Apply the gentlest puff of air imaginable to one side of your manometer. We’re talking about a sigh, not a hurricane. The fluid should jump to a new height and stay there.
If the column slowly droops back toward zero, you have a leak. This isn’t a minor inconvenience; it’s a deal-breaker. A leaking manometer is about as useful as a sundial on a cloudy day—beautiful in theory, useless in practice.
Common leak sources include:
- Loose tubing connections at the board
- Imperfect seals where tubing meets reservoirs
- Micro-fissures in old or cheap tubing
- The rubber stopper or connector itself
Finding and fixing these leaks is non-negotiable. Your pressure sensor calibration depends on a closed, stable system. The table below outlines typical calibration challenges and their solutions:
| Calibration Issue | Likely Cause | Diagnostic Test | Recommended Fix |
|---|---|---|---|
| Fluid levels unequal at start | Board not plumb or uneven mounting | Use a level on board surface | Adjust mounting until board is perfectly vertical |
| Slow drift after pressure application | Small leak in system | Apply pressure, mark level, wait 2 minutes | Check all connections with soapy water for bubbles |
| Fluid jumps then immediately returns | Major leak or open system | Listen for hissing at connections | Replace tubing or tighten all fittings |
| Uneven movement in both columns | Air bubble trapped in tubing | Observe fluid movement during test | Gently tap tubing to dislodge bubble, refill if needed |
| Sticky or sluggish response | Fluid too viscous or dirty | Compare response time to water reference | Clean system thoroughly, use fresh fluid |
Remember: calibration isn’t a one-time event. Check your zero before each use. Atmospheric pressure changes daily, and temperature affects your fluid density. That fancy barometer in your phone’s weather app? It needs regular pressure sensor calibration too.
The leak test should become muscle memory. Before connecting to any pressure source—whether a bicycle pump, your lungs, or that chemical reaction demo—verify your system holds pressure. This isn’t just good practice; it’s the difference between collecting data and collecting disappointment.
When both tests pass, your homemade manometer earns its stripes. You’ve transformed household items into a legitimate scientific instrument. The calibration ceremony is complete. Now you’re ready to measure something real.
Using Different Fluids (Water vs. Oil; Safety)
The liquid in your tube is more than just for looks. It’s key to making the P = ρgh equation work. Your choice of manometer fluid is a big deal, more important than the color or length of your tube.
Think of density (ρ) as your fluid’s personality. Water has a density of about 1000 kg/m³, making it easy to see. For a given pressure, it creates a tall water column. This makes it great for measuring things like your breath’s pressure.
Mercury, with a density of 13,600 kg/m³, is a different story. It’s dense and incredibly dangerous. The same pressure that moves water six inches will only move mercury half an inch. Mercury is a choice for those who want a smaller instrument.
Why does this matter for pressure measurement? Because P = ρgh means pressure equals fluid density times gravity times height. Changing the density changes the height for the same pressure. It’s all about physics, not personal preference.
For classroom use, water is the best choice. It’s safe, non-toxic, and easy to clean up. Adding food coloring makes the water column stand out against your measuring scale.
Oils and other fluids are alternatives. They’re less dense than water, so they create taller columns for the same pressure. But they can be messy and damage tubing. Stick with water for your first experiment.
Safety is a top priority. Water doesn’t need special handling, unlike mercury. Mercury is toxic and should be kept in a glass case.
So, choose water for your experiment. Add dye for visibility. Remember, your fluid’s density affects your instrument’s sensitivity. And keep mercury away, it’s not safe.
Converting Height to Pressure: The Math That Makes the Magic
You’ve built your manometer and added colored water. You see one side rise and the other fall. But what does that mean? It’s not just a measurement. It’s a direct link to pressure, thanks to simple math.
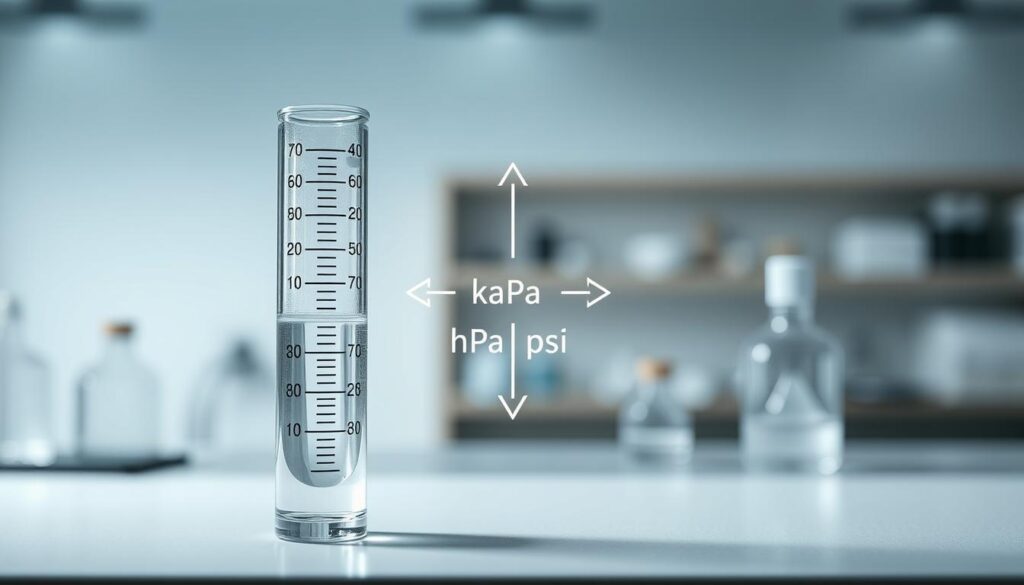
The Math That Makes It Work
Forget complex calculus. The secret to unlocking pressure is a simple equation. It’s like a Rosetta Stone for fluid mechanics. Your project turns from a craft to a scientific tool.
The King of All Equations: P = ρgh
This formula is your master key. Let’s look at the variables:
P = ρ * g * h
- P is the pressure you’re solving for, in Pascals (Pa).
- ρ (rho) is the fluid density (for water, about 1000 kg/m³).
- g is the acceleration due to gravity (9.8 m/s²).
- h is the height difference between the two fluid columns in your manometer, in meters.
Think of it this way: fluid density is its heaviness, gravity is the push, and height is the result. Together, they give you pressure.
From Lab Theory to Your Lab Bench
Let’s get concrete. Say your water column (h) has a height difference of 0.3 meters (about 12 inches). Plug it in:
P = ρgh = (1000 kg/m³) * (9.8 m/s²) * (0.3 m)
This calculates to 2,940 Pascals (Pa). That’s 2.94 kPa. In psi, it’s about 0.43 psi.
This is the essence of manometer calibration. It shows a direct link between height and pressure. It’s the pressure measurement principle that makes a colored water column a precision instrument.
Suddenly, that humble tube shows a direct, numerical pressure value. It’s not just a fluid level. It’s decoding the force behind it. That’s the leap from tinkerer to engineer.
Lab: Measure Boiler/Gas Canister Pressure Safely (Demo Rig)
It’s time to test your manometer with a real chemical reaction. This isn’t just a simulation. It’s a small, controlled, and messy piece of chemical engineering you can do at a desk.
We’re moving from theory to applied physics. We’ll use a classic chemical reaction to generate pressure we can see and measure.
The Chemical Reaction Engine
Our demo rig uses a classic chemical reaction: baking soda and vinegar. This reaction, NaHCO₃ + CH₃COOH, is a small, controlled pressure sensor event. It produces carbon dioxide (CO₂) gas, water, and a salt.
This gas production, trapped in a sealed vessel, creates the pressure spike we can measure.
We used the “Two-Way Cap” system, just like the university. It seals a soda bottle—our reaction vessel—to your U-tube manometer. You can control the reaction’s intensity with a 3D-printed scoop and a graduated cylinder.
The gas produced has nowhere to go. It pushes against the liquid in the manometer. This gives you a direct, visual, and satisfying measurement of the pressure switch from calm to chaos.
Safety First: The Demo Rig
We’re building pressure, not a bomb. The key is control. The demo rig is designed for safety and repeatability.
The two-way cap is non-negotiable; it contains the reaction and directs the generated CO₂ into your manometer, not into the room. Always wear safety glasses. Conduct the experiment in a well-ventilated area, and never use a glass container as the reaction vessel—use a sturdy, plastic soda bottle.
This setup isn’t just safe; it’s the core of the pressure sensor calibration process. It turns a simple reaction into a precise measurement tool.
The procedure is a dance of precision: measure your vinegar, load your baking soda, and seal the system before mixing. The moment you combine the reagents and cap the bottle, the pressure sensor calibration begins in real-time.
The manometer fluid climbs, and you’re not just watching a science fair project—you’re witnessing the direct conversion of chemical energy into measurable, physical displacement. This hands-on process is the ultimate pressure sensor test, proving that the theory on your workbench can handle the real, fizzy, unpredictable world of applied physics.
Error Sources and Uncertainty
Uncertainty is not a bug in your pressure gauge calibration. It’s a natural part of working with real-world fluids and human eyes. If your readings seem too perfect, question your assumptions, not the instrument.
The P = ρgh equation is perfect in textbooks. But your kitchen experiment is different. It deals with tilted boards, curved surfaces, and air bubbles. This isn’t a failure. It’s valuable data.
Let’s look at common mistakes in pressure measurement. The meniscus, where fluid meets air, can be tricky. Reading from the center or edges can make a big difference.
Parallax error is another issue. Your eyes can play tricks when reading at an angle. For accurate pressure gauge calibration, keep your eyes level with the fluid.
Is your board perfectly vertical? Gravity doesn’t care. A small tilt can affect your manometer calibration. Many students struggle with this simple geometry.
Air bubbles can also cause problems. They can compress and expand unpredictably. This makes your fluid column unstable. It’s not a malfunction. It’s just physics being playful.
There are also invisible errors. Temperature changes can alter your fluid’s density. Fluid friction in narrow tubes adds resistance. Your manometer calibration is affected by its environment, not a vacuum.
These errors don’t mean your device is broken. They show it’s working. The “uncertainty” in your pressure measurement is a sign of real-world data. It proves you’re not just calculating—you’re measuring.
Engineering students often face setbacks. But their failures are part of the learning process. They refine their designs through trial and error. Their struggle is valuable.
Document your errors. Note the room temperature and sketch the meniscus. Record if the board seems straight. This meta-data turns your pressure gauge calibration into a story. A story with a narrator who admits to uncertainty.
Embrace the uncertainty. It makes your experiment real and meaningful. Your manometer isn’t wrong. It’s giving you interesting answers.
Data Sheet Template & Example Calculations
If your manometer’s dance of fluid doesn’t get documented, did it even happen? This isn’t philosophy class—it’s engineering. The raw numbers are where your homemade gadget earns its stripes as a real instrument.
Think of this data sheet as the instrument’s flight recorder. It captures every wobble, every rise, every moment of equilibrium. Without it, you’re just guessing. With it, you’re doing pressure measurement.
The Data Sheet
Before you run your experiment, print this table or copy it into a lab notebook. Fill it in as you go. The act of recording forces you to observe, not just watch.
This template is inspired by professional resources like the Meriam measurement handbook, scaled down for our kitchen-table physics. Notice the three critical columns: what happened when, what you saw, and what it means.
| Time (s) | Height Difference (cm) | Calculated Pressure (Pa) |
|---|---|---|
| 0 | 0.0 | 0 |
| 15 | 12.5 | 1226 |
| 30 | 22.8 | 2234 |
| 45 | 30.1 | 2950 |
| 60 | 30.0 | 2940 |
See that last row? The height stabilized. The pressure reached its maximum. That’s your data point. The preceding rows show the dynamic response of your system—valuable information for understanding how pressure builds.
Proper manometer calibration begins with a zero check. Your first row should always be zeros. If it’s not, you’ve already found an error source.
From Height to Pressure: A Worked Example
Let’s crack the code. Your U-tube manometer gives you height. Science demands pressure. The bridge between them is a beautifully simple equation: P = ρgh.
Where P is pressure (Pascals), ρ (rho) is fluid density (kg/m³), g is gravity (9.8 m/s²), and h is the height difference (meters).
Take row 4 from our table: 30.1 cm of water. First, convert to meters: 0.301 m. Water’s density is roughly 1000 kg/m³. Now, do the math:
P = 1000 kg/m³ × 9.8 m/s² × 0.301 m
P = 2949.8 Pa, or about 2.95 kPa.
That’s the measured pressure. But what about the theory? If you’re using the baking soda and vinegar reaction from our lab, you can calculate the expected pressure from the gas produced. Use the ideal gas law: PV = nRT.
Here’s the friction, the beautiful disagreement. Your theoretical pressure might be 3.2 kPa. Your measured pressure is 2.95 kPa. Why the gap? Leaks? Temperature? Imperfect reactions?
That discrepancy isn’t failure. It’s the heart of experimental science. Your data sheet, with its calculated values, lets you quantify the uncertainty. It turns “seems about right” into “is off by 8%, likely due to…” That’s real pressure measurement.
So fill out every row. Compare your final column to your theoretical prediction. This final step completes the manometer calibration loop, proving your U-tube manometer isn’t just a toy. It’s a tool that generates trustworthy data.
Cleanup, Storage, and Re-use Tips
Every great experiment ends with the lab tech’s mantra: clean your station. Your DIY manometer is a precision instrument, not a one-party trick. To ensure its accuracy for the next pressure mystery, a proper post-lab ritual is essential.
Start by draining the manometer tube. For a water-based manometer fluid, simply drain the colored water down the drain. If you used a specialty fluid, check local guidelines for proper disposal. A thorough rinse is key. Flush the clear tubing with clean water to remove all traces of the colored fluid.
Stagnant water can become a science project of its own, and not the good kind. A clean, dry tube prevents mold and preserves the clarity of your pressure readings.
Storage is the unsung hero of the scientific method. Dry your manometer components completely before storing them. Coil the clean, dry tubing and store it with the backing board. Laying the assembly flat prevents kinks that could compromise your future pressure gauge calibration.
This isn’t clutter; it’s a calibrated instrument awaiting its next mission. A properly cleaned and stored manometer is a permanent lab asset. When you need to check the pressure from an aquarium pump or a compressor, your rig is ready.
This is the opposite of single-use science. It’s a tool, built, calibrated, and maintained. The final step in pressure gauge calibration is knowing your instrument will be ready, not in a drawer, but on the bench, ready to measure again.
