Teaching thermodynamics for schools can be tough. It’s like explaining a meme to your grandpa. The ideas are all around, but they lack context.
We’re not just throwing standards at you. We’re diving into the philosophy. The National Academy says science is about using evidence to explain things.
Frameworks like the Texas TEKS (hello, 7.2.B and 7.2.E!) ask us to question and analyze. This helps us predict what will happen next.
This is like the director’s commentary for your curriculum. We’re moving away from just memorizing. It’s about understanding the why.
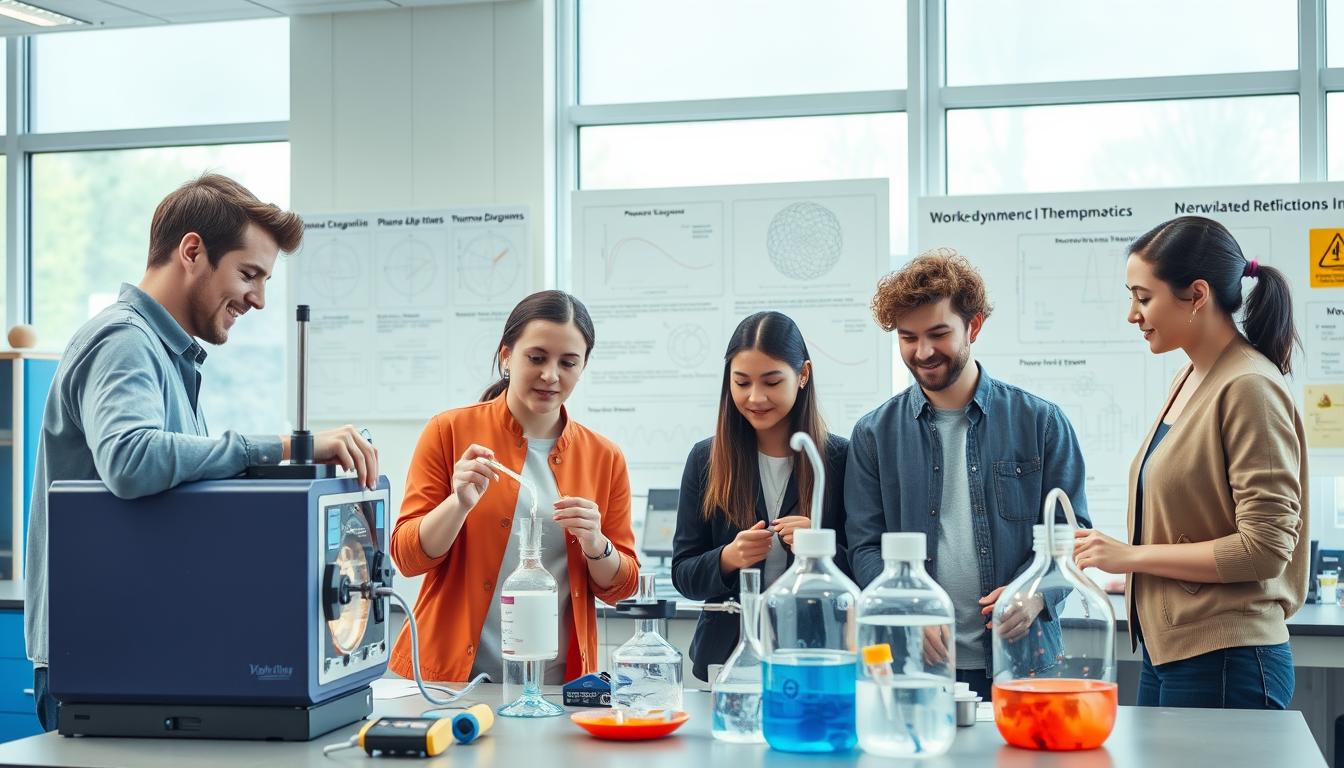
A phase change lab is more than a fun activity. It’s a real investigation. The highlight is when a student’s prediction is proven right.
Imagine a classic steam engine demonstration. The hot data shows us the power of work and pressure. That’s what we’re exploring.
Lab 1: Boiling vs. Pressure (setup, data, graphs)
Forget watching a pot boil; we’re about to stage a scientific heist to steal boiling point’s best-kept secret. Your students are no longer just students. For this lab, they’re chemical engineers reporting for a shift at a simulated power plant facility. Their mission? To interrogate H₂O under heat and document its every move.
The setup is elegantly simple, a classic of kitchen-sink science gone professional. You’ll need a heat source, a pot, some ice, and the star witness: a temperature sensor. A LEGO NXT or a Vernier probe works perfectly. The key directive? Place the sensor directly in the pot, submerged with the ice from the start. This turns a simple observation into a continuous data stream.
As the ice melts and the water heats, the real drama unfolds on screen. The data logging software—whether it’s the NXT program or another platform—becomes your live feed. It plots temperature against time, creating a graph that tells a story in three distinct acts.
Act One is the flatline. The ice phase holds its temperature steady, a dramatic pause as energy works to break the solid lattice. Then comes the steady, rising climb of liquid heating—the plot thickens. Students should be recording these phase changes and temperatures in their data tables, building their empirical case.
The climax is the plateau. Just as the action seems destined to climb forever, the line goes horizontal around 100°C. This is the molecular rebellion. Energy is now spent breaking bonds to create steam, not raising the temperature. This plateau is the whole point. It’s where students must identify the new state of matter—a gas—and officially record water’s boiling point.
This lab teaches that sensors are not mere gadgets; they are confidential informants. The graph isn’t just a picture; it’s the testimony. And those data tables? They’re the sworn affidavit from the scene. It’s where the abstract concept of “phase change” gets caught on tape, and the relationship between pressure and boiling point begins its first cross-examination.
Lab 2: Expansion Does Work (Syringe Piston Lab)
Forget the drama of an imploding soda can; our second act features a syringe and flask, turning a classic party trick into a physics lesson you can feel. The pressure-volume relationship isn’t some abstract graph in a textbook here. It’s the shove you feel against your thumb when a sealed syringe plunges into hot water and the piston defiantly rises.
We’ve all seen the “balloon in a flask” demo. A deflated balloon sits in an empty flask, its neck sealed over the mouth. Heat the flask, then cool it. The balloon inflates inside. Magic? Hardly. It’s a perfect visual for the atomic shoving match we’re about to quantify.
Here’s the setup. Take a standard plastic syringe. Pull the piston to about the halfway mark. Seal the tip tightly with a cap or clay. This trapped air is our test subject. Now, immerse the syringe barrel in a beaker of hot water. Watch. The piston moves. It’s not subtle.
This is where students often get poetic. “A vacuum is created inside when it cools, sucking the balloon in!” they’ll proclaim. I love this misconception. We weaponize it. Is it a pull or a push? Let the syringe be the judge.
When you heat that trapped air, you’re giving its molecules a caffeine shot of thermal energy. They zip around faster, hitting the walls of the syringe with more force. This increased internal pressure overwhelms the constant atmospheric pressure outside. The piston isn’t sucked out; it’s pushed out by the energized gas inside.
The real proof comes when you remove the syringe from the hot water. As it cools, the internal pressure drops. The higher external atmospheric pressure now wins the shoving match, pushing the piston back in. The outside air does work on the gas. This back-and-forth is the core of the pressure-volume relationship: change one, and the other responds with force.
To move from “cool demo” to “quantitative lab,” we measure. Mark the piston position at room temperature. Mark it again at its peak in hot water. The volume change is direct, measurable work. The gas inside expanded against the force of atmospheric pressure and your thumb. It did work on the piston. You felt it.
| Common Student Prediction | Actual Observation | The Physics Principle |
|---|---|---|
| The syringe piston is “sucked” up by a vacuum when heated. | The piston is pushed up by increased internal gas pressure. | Heating a gas increases particle kinetic energy and pressure. |
| Cooling the syringe creates a “sucking” force pulling the piston in. | Atmospheric pressure pushes the piston in as internal pressure drops. | Work is done by the external atmosphere on the gas. |
| Volume change is random or magical. | Volume change is directly proportional to temperature change (if pressure were constant). | Charles’s Law illustrates the direct temperature-volume relationship. |
| No real force is involved; it’s just air moving. | A palpable force is felt resisting the piston’s movement. | Pressure is force per unit area; movement against it is work. |
This lab cuts through the abstraction. Work isn’t just a formula (W = PΔV). It’s the resistance in your thumb. The debate about pull versus push isn’t just semantics; it’s a fundamental shift in thinking about how gases interact with their environment. The syringe makes the invisible pressure-volume relationship unmistakably tangible.
So, ditch the diva-like soda can. The humble syringe delivers a clearer, more honest performance. It shows expansion under pressure isn’t just hot air. It’s the raw, shoving reality of thermodynamics at work.
Lab 3: Mini-Engine Input vs. Output Snapshot
Labs 1 and 2 were full of hope. But Lab 3 is a harsh efficiency snapshot we didn’t want but needed. Here, a tiny steam engine model turns into a tool for checking how well things work.
This lab is where students connect the dots. Lab 1 showed the drama of boiling water under pressure. Lab 2 showed how steam can do work. Now, we ask: How much of that effort actually pays off? The answer is a lesson in how the universe is not always efficient.
Heating a water reservoir with a burner is the first step. The steam then drives a piston, which spins a flywheel. Our task is to measure this process precisely.
The difference is more than just a number. It’s about wasted steam and a flywheel that stops easily. It’s like realizing only 20% of a meeting is useful. The rest is just talk.
This mirrors real-world engineering needs. Chemical engineers use data to design efficient systems. Our mini-engine is like their small-scale world.
Let’s look at typical audit findings:
| Energy Component | Measurement Method | Typical Result | The Story It Tells |
|---|---|---|---|
| Heat Input (Qin) | Burner fuel mass & calorific value | High | We committed a lot of resources. |
| Rotational Output (Kout) | Flywheel speed & moment of inertia | Surprisingly Low | We got very little tangible return. |
| Efficiency (η) | η = (Kout / Qin) x 100% | ~5-15% | The system is tragically wasteful. |
Calculating efficiency is humbling. It’s where students face the Second Law of Thermodynamics. Entropy isn’t just a concept; it’s the heat that does nothing but warm the bench.
Our machines and calendars are wasteful. The efficiency snapshot makes us question this. The energy isn’t lost; it’s just wasted in the environment.
This lab isn’t about making better engines. It’s about learning to spot waste in any system. This insight is the first step to making things more efficient.
Safety Briefs for Each Lab
Safety rules are often seen as boring, but in these labs, they’re key to avoiding danger. We’re not just following rules; we’re learning to play a game of science safely. It’s like getting a special guide from someone who knows the lab well.
Preventative safety equipment is more than just stuff. Chemical splash goggles protect you from hot liquids and steam. An apron keeps your clothes safe from spills. Gloves keep your hands warm when handling hot things. These steps are basic for safe science.
The heat source is a big deal. Things like hot plates and stoves seem calm but are very hot. Treat the whole area around them as dangerous.
Boiling water is very dangerous because it can cause serious burns. This is because steam can burn you much worse than hot water. So, keep a safe distance to avoid accidents.
Your glassware is important too. Borosilicate glass like Pyrex is safe for hot things. But cheap glass can break easily, causing problems. Make sure your glass is good quality.
Here’s what you need to remember for all three labs:
- Goggles On, Always: From start to finish. No breaks.
- Heat Source Respect: Have someone in charge, use tools, and stay back.
- Mind the Steam: Keep steam away from people. It can burn without warning.
- Glass Integrity: Use safe glass for hot things. Check it for damage.
By following these safe practices, you can handle the lab safely. You’ll go from being scared to feeling in control. That’s the first real experiment.
Data Templates and CER Framework
If your students’ lab notes look like a detective’s scribbled hunches, it’s time for the Claim-Evidence-Reasoning framework. Raw measurements are just noise without a structure to give them meaning. Our job is to provide the scaffolding that turns observational chaos into a compelling scientific argument.
Think of CER as the closing statement in a courtroom drama. The Claim is the verdict, the Evidence is the exhibits, and the Reasoning is the lawyer’s brilliant summation. We’ve embedded this framework directly into our lab handouts. This isn’t about filling in blanks; it’s about building a case for the laws of thermodynamics.
Let’s talk about the Claim. A weak claim states, “Water boils at 100°C.” A powerful, NGSS-aligned claim argues, “The boiling point represents an energy plateau where input heat breaks intermolecular bonds instead of increasing kinetic energy.” Big difference. The template prompts students to think at that higher level.
The Evidence comes from pristine, organized data tables and graphs. For Lab 1, the temperature-time graph is the star witness. Standards like 7.2.C and 7.2.D aren’t just bureaucratic checkboxes. They mandate collecting data in SI units and constructing tables to identify patterns. We give students the graphic organizers to do this right.
Now, the Reasoning. This is where students connect their evidence back to the particle model. Why does the temperature flatline during a phase change? The reasoning section forces them to cite the molecular ballet of bond-breaking, tying the graph on their paper to the invisible world.
Our provided templates are the silent co-teacher in the room. The States of Matter Data Sheet (pdf) offers a structured space for qualitative observations—labeled drawings, written descriptions—alongside quantitative data tables. It’s a one-stop shop for 7.2.C compliance.
How does this look in practice? Compare the old way to the CER way.
| Component | Traditional Lab Report | CER-Structured Report |
|---|---|---|
| Claim | “The water boiled.” | “Boiling is an energy-intensive bond-breaking process, not a simple temperature increase.” |
| Evidence | A list of numbers. | A formatted graph identifying the plateau, sourced from organized data tables. |
| Reasoning | “Because it got hot.” | “The constant temperature indicates energy is being used to overcome hydrogen bonds, aligning with the particle model of matter.” |
This structure transforms students from passive note-takers into active advocates. They aren’t just recording that steam expands a piston; they’re arguing that work requires an energy transfer, with their own data tables as the foundation. The framework turns them into lawyers for physics, and the verdict is always guilty of learning.
Differentiation: Younger vs. Older Learners
Teaching thermal dynamics to different age groups is like directing a play. For fifth-graders, it’s about the big, visible actions like boiling water. Ninth-graders dive into the details of how it works.
It’s not about writing two plays. It’s about directing the same masterpiece for two different audiences.
The main change is from the “what” to the “why.” Younger learners, like those in fifth grade, focus on observing. They track the temperature and feel the force of the syringe. Their model is like a sheet of smiling dots that move faster when hot.
Older students, like those in ninth grade, are junior engineers. They explore why pressure changes and how to measure it. Their model includes arrows and math.
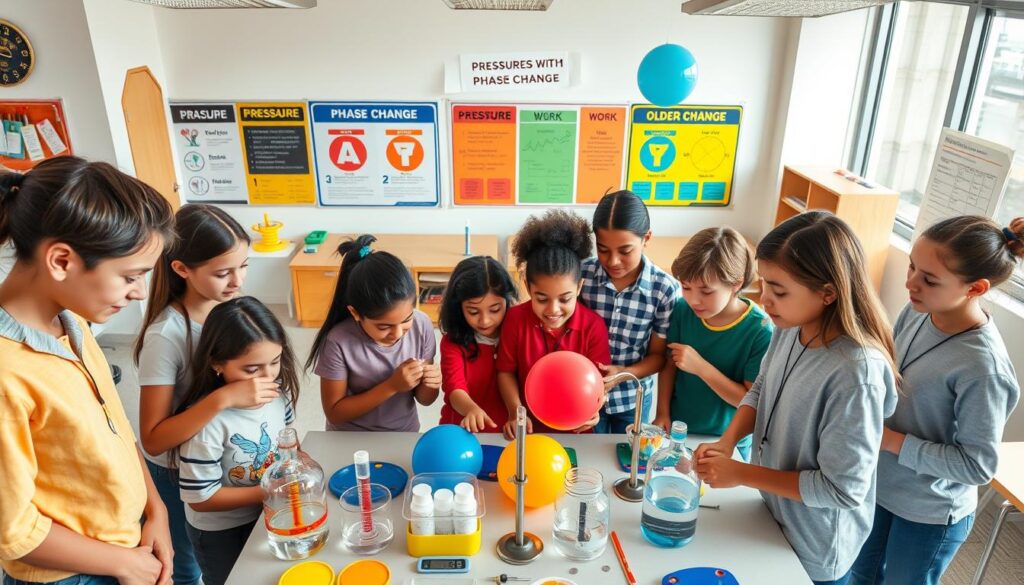
This table helps you adjust your teaching for different ages in one classroom.
| Focus | Younger Learners (e.g., 5th Grade) | Older Learners (e.g., 9th Grade) |
|---|---|---|
| NGSS Anchor | 5-PS1-1: Develop a model to describe that matter is made of particles too small to be seen. | MS-PS1-4: Develop a model that predicts and describes changes in particle motion, temperature, and state… |
| Core Question | “What is happening?” (Observation & Description) | “Why is it happening, and how can we measure it?” (Causation & Quantification) |
| Particle Model | Qualitative. Dots that “vibrate more” or “spread out.” Focus on state change. | Quantitative. Particles gain kinetic energy; collisions cause pressure. Introduce ideal gas law approximations (P ∝ 1/V). |
| The Syringe Lab | “Feel the work.” The push is a tangible force. Measure distance moved. | “Calculate the work.” Use force and distance. Debate efficiency (Input thermal energy vs. Output mechanical work). |
| Assessment Shift | Did you accurately describe and draw the phases? | Can you predict a new pressure for a given volume change? |
This isn’t about making work. It’s about building on their learning. Both groups start with the same experiment. The core concepts and objectives are the same. The depth of analysis changes.
For younger learners, you validate their wonder with data. For older learners, you provide the math. Both leave the lab amazed, but in different ways.
Cross-Curricular Links (history/ELA/math)
The steam engine did more than just power factories. It sparked debates, inspired writing, and needed new math. Treating labs as just science misses the point. The real learning comes when we connect with other subjects.
History is a key area where we can link the steam engine to the Industrial Revolution. This era was marked by soot and steel, all thanks to Lab 2’s principles. But was it progress? The debate is whether the steam engine freed us or trapped us in pollution. It shows science has a big impact on history.
English Language Arts also plays a role. Scientists write, and their words are primary sources for analysis. Imagine studying James Watt’s notebook. It’s raw technical writing. Ask students to analyze his writing. What was his goal? Who was he writing for? How does his tone change?
Math is where theory meets reality. Plotting data from Lab 1 isn’t just making a graph. It’s about functions. Is the line straight? Where does it stop changing? Algebra becomes a way to understand the world.
Then, look at engine efficiency from Lab 3. It’s about input versus output. This is a ratio, a percentage, and a story of waste and innovation. It shows math isn’t just numbers. It’s the language of physics.
These cross-curricular links turn a lab report into a part of a bigger story. They show scientists like James Watt as problem-solvers, not just geniuses. The goal is to make learning feel connected, not isolated.
Grading Rubrics and Exemplars
Grading science labs can feel like a tough task. It’s like doing an autopsy on a frog. But we want to change that. We aim to make grading a helpful guide, not a punishment.
A good grading rubric looks at the whole journey, not just the end. It values the quality of the question and the data collected. The final answer is just the icing on the cake.
- The Hypothesis: Is it testable? Does it show a good understanding of the variables?
- The Data: Is it precise, complete, and easy to read?
- The CER Framework: Does the claim have solid evidence? Is the reasoning clear and scientific?
Being open is important. Students should see how to get an “A” as clearly as they see data on their graphs. That’s where exemplars help.
Look at how data is presented. A good table is clear and organized. It makes it easy to see trends.
Claims also show a big difference. A weak claim might say, “The balloon went in.” But a strong claim explains why, like, “A decrease in internal gas pressure made the balloon go in.” That’s real science.
This way, feedback becomes a conversation. It shows students where they stand and how to improve. It makes assessment clear and helpful, not just a grade.
This approach makes complex ideas easy to understand. It’s what makes projects like the pop pop boat so powerful. They show how simple ideas can lead to deep understanding.
To make this work, we give a detailed grading rubric and examples. We also offer resources like the States of Matter Post-Assessment Answer Key. It’s not just answers. It’s a guide for discussion and learning.
So, students start asking how to improve, not just why they got a certain grade. That’s the change we want. From just judging to actually helping.
Extensions: Compare Steam to Compressed Air
Steam powered the 19th century, but today, compressed air drives robotics. Which is better? Let’s explore. For the student who finishes early and wonders, “What’s next?”, this is your answer. We move from steam to its modern cousin: pneumatics.
Why do factories use air-powered tools more than steam? It’s not just to avoid boiler explosions. This comparison is a great way to apply what you’ve learned about pressure, phase change, and work.
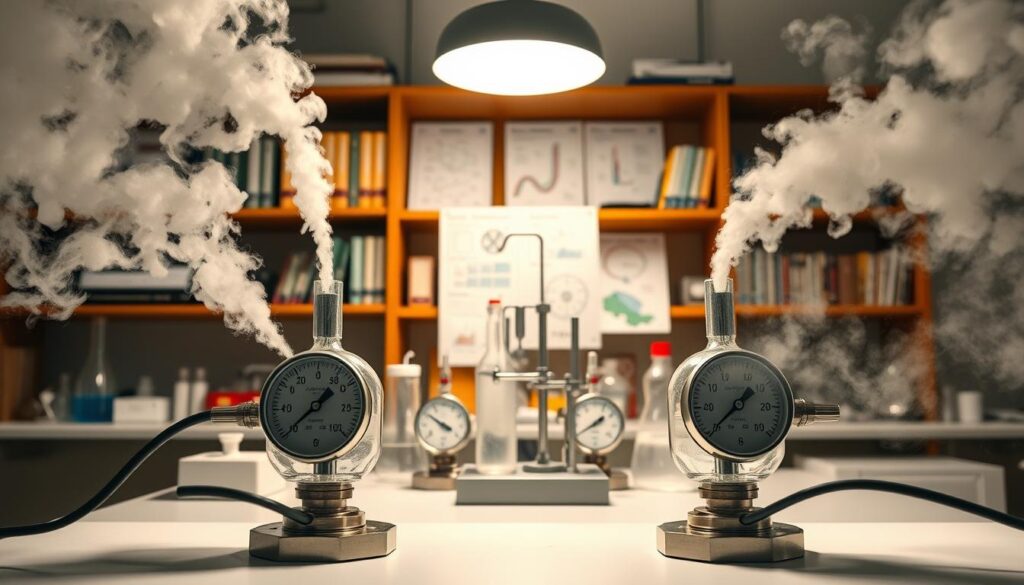
We compare a classic steam piston with a modern air piston. It’s not just about who wins. It’s about what makes a system better. Which one has more power? Which is faster? Which is safer to use?
This isn’t just a lab. It’s a chance to be an engineer. You design tests to measure force, distance, and time. You’ll see why pneumatics are used on assembly lines. Compressed air is clean and fast, but steam has a thermal advantage.
The real benefit is the connection. Those old principles are alive today. They’re in your car’s tires and the power of a rivet gun. By comparing them, you link the Industrial Revolution to today’s automation. You show that physics is alive and important today.
Teacher Prep List and Timing
Let’s talk about the details. A well-prepared lesson can make all the difference. Think of it like a pre-flight checklist created by someone with experience — helping you avoid that last-minute “Oh, I needed that?” moment.
For this hands-on phase change lab, you’ll need several key materials: a LEGO MINDSTORMS NXT Education Base Set, three pounds of ice cubes, a metal pot, and a hot plate. You’ll also need a 200-mL Erlenmeyer flask and a 12-inch balloon. This equipment list is practical and designed to demonstrate thermodynamics concepts in action.
Preparation for this lesson takes about 15 minutes, while the core activity runs approximately 30 minutes. However, plan for a full 52-minute class period to allow time for setup, student questions, and cleanup. Effective planning reflects real-world engineering practices — similar to workflows used in professional environments and heavy machinery solutions, where preparation and safety checks are essential before any operation begins.
My top tips? Stretch the balloons the day before the lesson. Charge all sensors overnight, and always keep a backup hot plate available. These small preparation steps can transform a good lab experience into a seamless and highly engaging one.
This practical guide helps make your steam power lesson memorable. Strong preparation turns complex thermodynamics concepts into meaningful hands-on learning experiences that students will remember long after the class ends.
